Quick Answer
For a 6 kW residential system, 20% shading reduces annual production by 1,200–1,500 kWh — that is $3,750–7,500 in lost value over 25 years (SolarTech Online, 2025). A perfectly south-facing roof with no obstructions would score 100% Solar Access. A roof partially blocked by a tree might score 85%.
For a 6 kW residential system, 20% shading reduces annual production by 1,200–1,500 kWh — that is $3,750–7,500 in lost value over 25 years (SolarTech Online, 2025). Every solar proposal includes a shade report PDF to document exactly that risk. The problem is that fewer than half of sales reps can explain what the three numbers in that report actually mean — and most homeowners have never heard the word TSRF before signing a contract.
For a 6 kW residential system, 20% shading reduces annual production by 1,200–1,500 kWh — that is $3,750–7,500 in lost value over 25 years (SolarTech Online, 2025). A perfectly south-facing roof with no obstructions would score 100% Solar Access. A roof partially blocked by a tree might score 85%.
This guide is written for three audiences, in this priority order: solar designers who need to know what the numbers mean for BOM and string topology, sales reps who need to explain the numbers on a call, and homeowners reviewing a quote who want to know what to check before they sign. Whether you are using a solar design software that generates the report natively or reviewing a PDF from a third-party tool, the interpretation logic is the same. We cover all three metrics from definition to decision, including real worked numbers, an accuracy comparison across measurement methods, and the exact TSRF thresholds required by major incentive programs. Read more about Agricultural Solar Case Study.
The report itself is a decision prompt. Reading it correctly changes what equipment you spec, which incentive programs you pursue, and how you explain winter output to a homeowner who will otherwise call you in January wondering why their bill is higher than expected.
TL;DR — Reading a Solar Shade Report
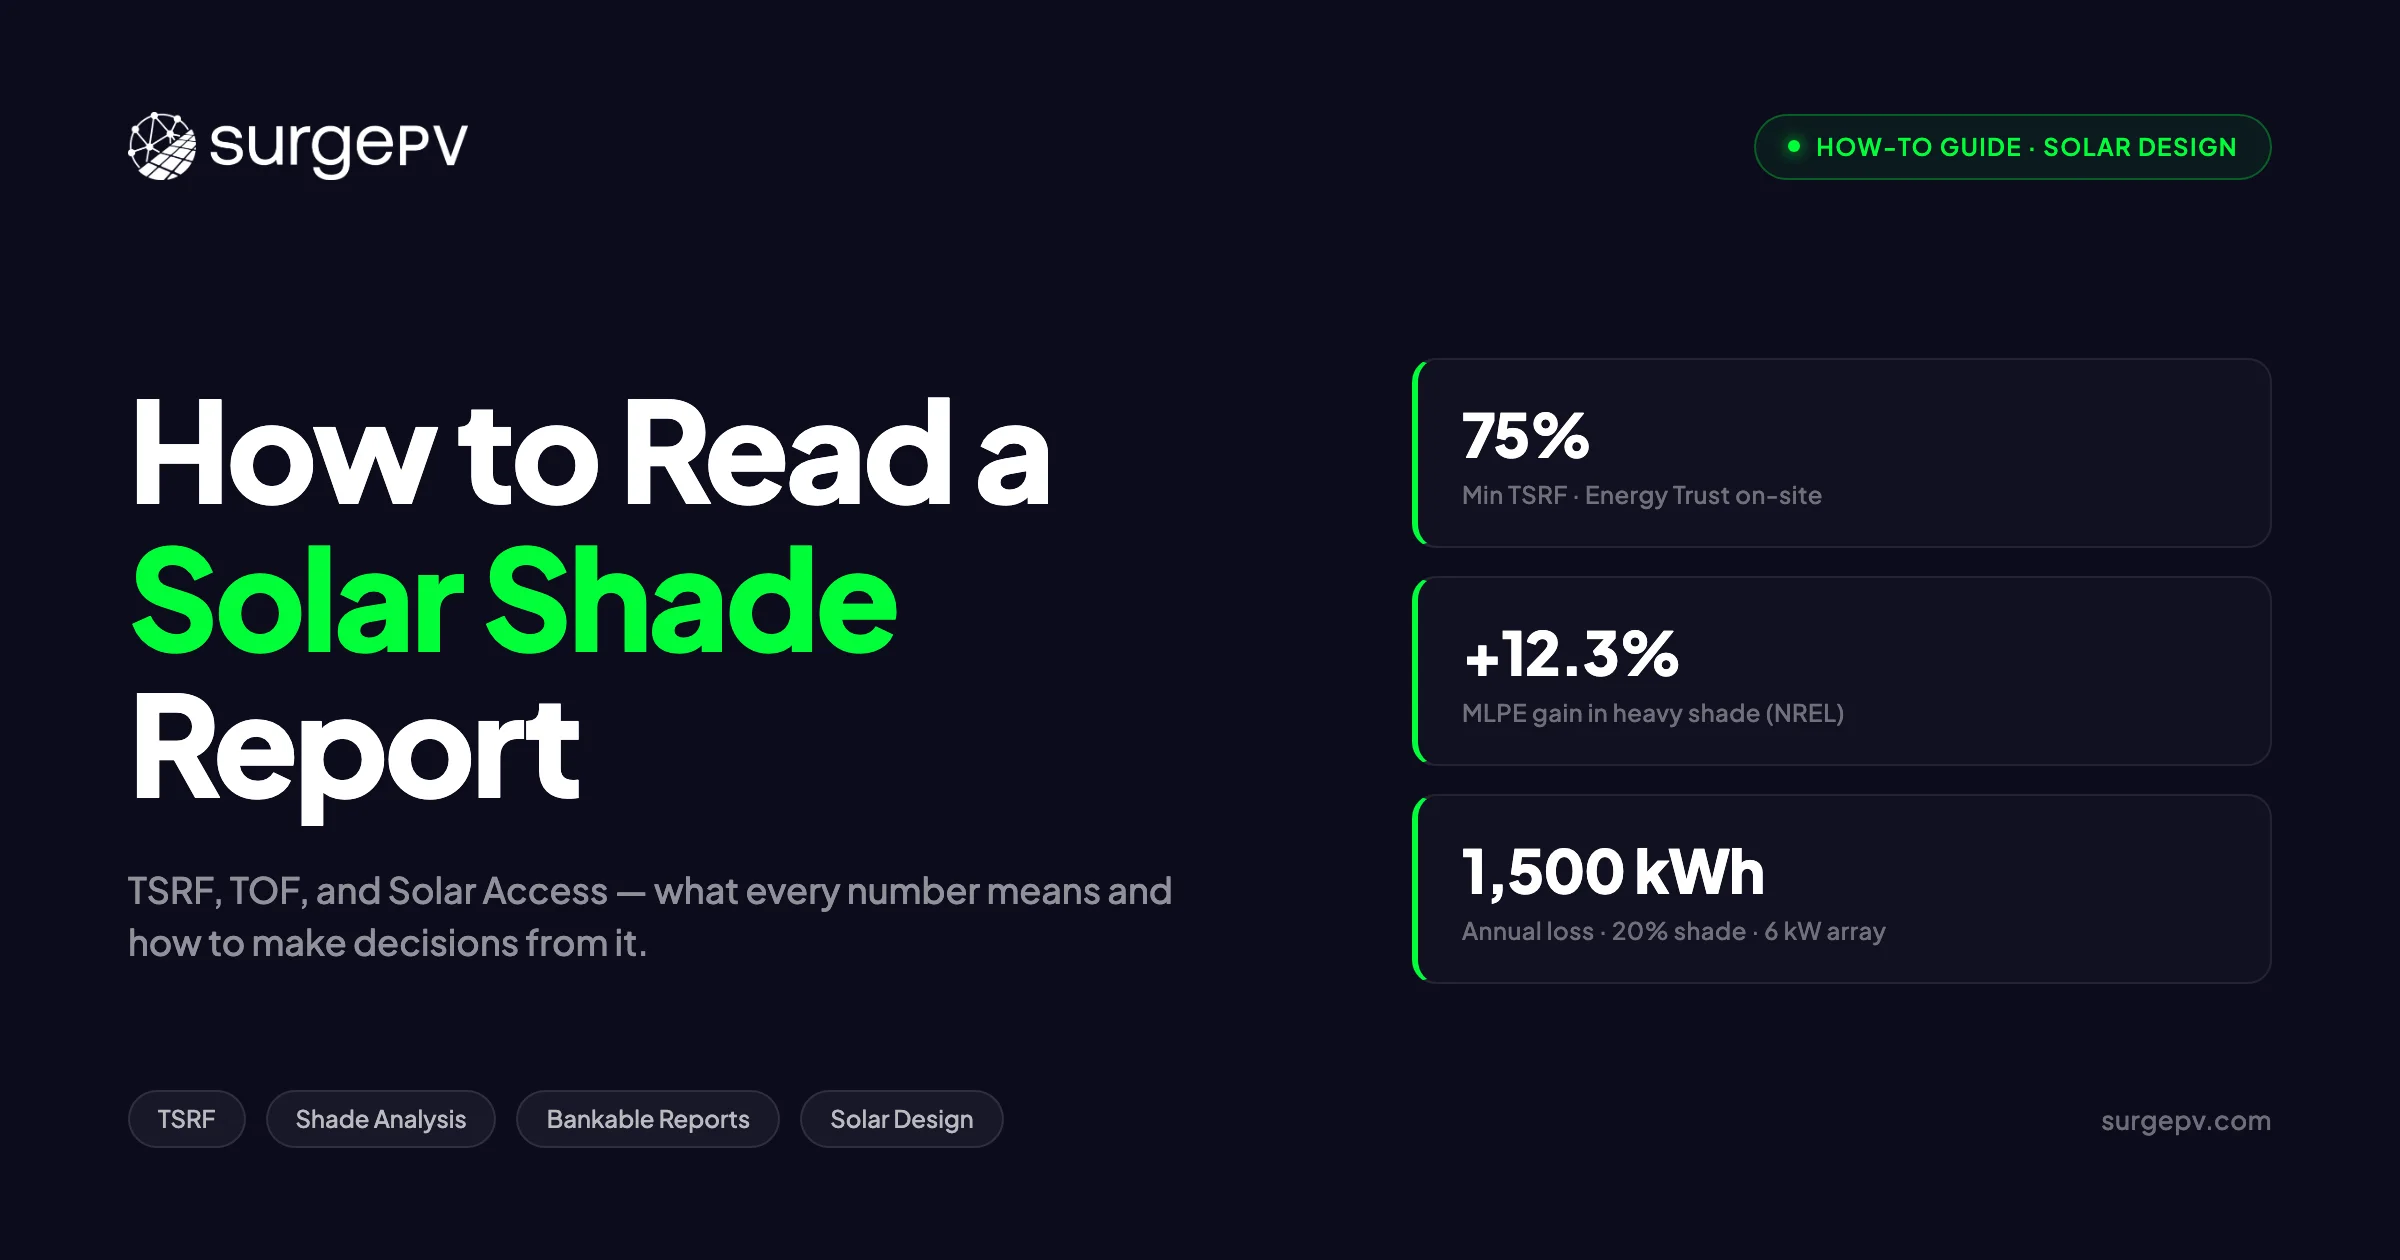
A solar shade report shows three numbers: Solar Access (shade-only loss), TOF (tilt and orientation penalty), and TSRF (the combined score, calculated as Solar Access × TOF). Most incentive programs set a minimum — Energy Trust of Oregon requires TSRF ≥75% for on-site tools and ≥80% for remote analysis. Check the monthly bar chart for seasonal shading spikes before signing off on any design.
In this guide:
- What Solar Access, TOF, and TSRF each measure — and how they combine into a single score
- How to walk through a real shade report line by line (HelioScope worked example with actual numbers)
- Which measurement method — Solar Pathfinder, SunEye, drone, LiDAR, or 3D software — is accurate enough for bankable reports, and what NREL validation studies found
- The exact TSRF thresholds required by Energy Trust of Oregon, NYSERDA, MassCEC, and other major incentive programs
- How to interpret the month-by-month solar access bar chart and spot problematic winter shading
- A TSRF decision tree: what actions to take at ≥85%, 75–85%, 70–75%, and below 70%
- How to explain a shade report to a homeowner in 30 seconds — plus scripts for installers, designers, and sales reps
What a Solar Shade Report Actually Is
A solar shade report is a technical document generated by solar design software that quantifies how much solar irradiance a specific roof plane receives relative to an ideal, unobstructed surface at the same location. It is not a visual diagram of shadow patterns — it is a numerical output that answers a precise question: how much of the theoretically available sun energy actually reaches this roof?
The report exists because incentive program administrators, lenders, and production guarantee providers require documented proof that a roof qualifies before committing funds. An installer’s verbal assurance that “the roof gets good sun” is not enough. A bankable shade report, generated by an approved tool and signed off by the system designer, is the documentation standard.
The report’s underlying weather model is NREL’s National Solar Radiation Database (NSRDB), which provides half-hourly irradiance values at 4 km × 4 km spatial resolution and can be used to derive Typical Meteorological Year (TMY) data for any US location (NREL #75573, FY2020). That TMY dataset is the hourly baseline against which the shading simulation runs — so when the report says “88.2% TSRF,” it means 88.2% of the TMY-predicted irradiance actually reaches the roof plane after accounting for shade and orientation.
Three metrics appear on every shade report. They build on each other in sequence.
Solar Access % measures shade-only loss. It compares the irradiance that reaches the module after shading to the irradiance that would reach the same surface with zero shade. Formula: Shaded Irradiance ÷ Plane-of-Array (POA) Irradiance (HelioScope, 2025). A perfectly south-facing roof with no obstructions would score 100% Solar Access. A roof partially blocked by a tree might score 85%. The orientation of the roof does not affect this number — only the shade does.
Tilt and Orientation Factor (TOF) measures the orientation penalty. It compares the actual POA irradiance received at the roof’s real pitch and azimuth to the optimal POA irradiance available at the ideal tilt and orientation for that latitude. Formula: Actual POA Irradiance ÷ Optimal POA Irradiance (Aurora Solar, 2024). A perfectly-pitched south-facing roof in most of the US would score close to 100% TOF. A north-facing roof at the same latitude might score 70–75%. For software options, see 7 Best Aurora Solar Alternatives in.
Total Solar Resource Fraction (TSRF) is the combined score. Formula: TSRF = Solar Access % × TOF (HelioScope, 2025). It captures both problems — shade and orientation — in a single figure that incentive programs and lenders can evaluate against a threshold. A roof with 91.9% Solar Access and 96% TOF produces a TSRF of 88.2%.
TSRF is the number that matters for incentive eligibility, but it is also the number that can mislead you if you stop reading there. An 82% system TSRF can hide a single plane at 68% pulling down an otherwise clean roof. The section-level and module-level breakdowns matter as much as the headline figure. Accurate solar shadow analysis software will show you both — the system summary and the plane-by-plane detail needed to make BOM decisions.
How to Read the Three Numbers: Solar Access, TOF, and TSRF
The fastest way to build intuition for a shade report is to walk through a real example with real numbers. The following figures come from HelioScope’s published documentation (HelioScope, 2025):
| Metric | Value | Formula |
|---|---|---|
| Optimal POA Irradiance | 2,165.1 kWh/m² | Best-case irradiance at this location |
| Actual POA Irradiance | 2,077.9 kWh/m² | Irradiance at this roof’s actual pitch/azimuth |
| Shaded Irradiance | 1,910.4 kWh/m² | Irradiance remaining after shading |
| TOF | 96% | 2,077.9 ÷ 2,165.1 |
| Solar Access | 91.9% | 1,910.4 ÷ 2,077.9 |
| TSRF | 88.2% | 91.9% × 96% (or 1,910.4 ÷ 2,165.1) |
Solar Access — Reading the Shade Number
Solar Access measures one thing only: how much irradiance the shade removes. It does not penalize the roof for pitch or direction. A perfectly south-facing, 30° pitched roof with a tree blocking 10% of the sky will show lower Solar Access — not because of the pitch, but because of the tree.
In the HelioScope example, the roof loses 167.5 kWh/m² to shade (2,077.9 − 1,910.4 = 167.5), producing a Solar Access of 91.9% (HelioScope, 2025). The practical rule of thumb: Solar Access above 90% means minimal obstruction and standard design is appropriate. Below 85% means there is something meaningful blocking the sun, and you should identify what it is and whether it can be mitigated.
One nuance worth knowing: Solar Access is never exactly 0% even with a completely shaded surface, because diffuse irradiance still reaches a panel that has lost all direct sunlight (OpenSolar). Shade reports that show 0% Solar Access on a module typically indicate a data error, not a real site condition.
One program explicitly cares about Solar Access % alone: Oncor’s Texas solar program requires installers to report the annual unshaded percentage — and the program manual explicitly states that TOF and TSRF values should not be used in the submission (Oncor, 2024). If you are submitting to Oncor, pull the Solar Access figure, not the TSRF.
TOF — Reading the Orientation Penalty
TOF is a geometry penalty with no shade in it at all. Remove every tree, every chimney, every obstruction — TOF still reflects only how well the roof’s pitch and azimuth capture the available sun at that latitude relative to the theoretical optimum.
In the HelioScope example, the actual POA of 2,077.9 kWh/m² compared to the optimal 2,165.1 kWh/m² gives a TOF of 96% (HelioScope, 2025). A south-facing roof pitched at 30° in most of the US will score close to 100% TOF — it is already close to optimal. A north-facing roof at the same pitch and latitude can range from roughly 71% TOF on a steeper 4/12 pitch to roughly 92% on a shallow 1/12 pitch in mid-latitude locations such as Charlotte, NC (Solar Power World, 2016). East- and west-facing roofs typically land in the 78–95% range depending on tilt and latitude (verify with NREL PVWatts for your location).
The practical implication for designers: low TOF is not fixable without changing the roof. You cannot trim a tree to improve TOF. If a homeowner’s roof scores 80% TOF because it faces northeast, the only options are to reorient panels to a better-performing face or accept the penalty.
TSRF — The Combined Score
TSRF multiplies Solar Access by TOF to produce a single figure that captures both loss sources: 91.9% × 96% = 88.2% (HelioScope, 2025). This is the number that appears on incentive applications and lender documentation.
The 80% threshold is widely considered the industry benchmark for economic feasibility, originally established by a consortium of industry experts including NREL and subsequently adopted by NYSERDA and the Rhode Island Renewable Energy Fund (Energy Trust Cadmus review). Some programs set the floor lower — MassCEC’s Mass Solar Loan accepts 70% weighted average.
Important
A 100% TSRF is rare in practice. The goal is not perfection — it is clearing the incentive threshold at the worst-performing plane. (Derived from Sunbridge Solar, 2024)
Still Generating Shade Reports as Static PDFs?
SurgePV’s solar shadow analysis software renders shadows on a cloud-based 3D model and embeds the live visualization directly in your proposal — no desktop install, no disconnected files.
See It in ActionNo commitment required · 20 minutes · Live project walkthrough
Comparing Shade Measurement Methods: Accuracy, Cost, and Incentive Acceptance
The accuracy question matters because a remote report that overstates Solar Access by 5% can push a borderline system above an incentive threshold — and trigger a production guarantee claim 3 years later when measured output falls short. Not all shade reports are created equal, and not all programs accept all methods.
| Method | Typical Accuracy vs. SunEye | Cost per Site | NREL Validated? | Programs That Accept It |
|---|---|---|---|---|
| Solar Pathfinder (handheld) | ±10–15% | $299–349 (device, as of April 2026) | No formal NREL study | Energy Trust OR, NYSERDA, MassCEC |
| Solmetric SunEye (handheld) | Reference standard | $2,195 (device, as of April 2026) | Used as NREL baseline in all studies | All major programs universally |
| Remote satellite/LiDAR software (e.g. Aurora, HelioScope) | ±3–5% SAV with LiDAR | $1,620–2,642/yr (HelioScope subscription, as of April 2026); Aurora Solar pay-per-project | Yes — Aurora ±5 SAV (NREL #65558, FY2016); LiDAR improves to ±3 SAV | NYSERDA, MassCEC, Energy Trust, RI REF |
| Drone on-site (e.g. Scanifly) | Within ±1% of SunEye | $1,500–2,000/site (service, as of April 2026); $1,700–2,000 (equipment, as of April 2026) | Scanifly: within 1% of SunEye (Scanifly, 2023) | MassCEC, RI REF, others — verify per program |
| Satellite-only (no LiDAR) | ±10%+ on tree-heavy sites | $0–200/site (varies by platform, as of April 2026) | No | Pre-qualification only — most programs do not accept |
(Accuracy data: NREL #65558, NREL #70036, Scanifly 2023)
The NREL Aurora validation study found that Aurora’s estimated annual Solar Access Values (SAVs) were statistically equivalent to SunEye within ±5 SAVs in both Los Angeles and Denver; at Denver sites where LiDAR was available, accuracy tightened to ±3 SAVs (NREL #65558, FY2016). A follow-up Aurora blog citing the same DOE-funded research stated that remote shading engines implementing LiDAR were within 3.5% of on-site measurements (Aurora Solar, 2024-12-11).
Drone-based analysis from companies like Scanifly reports an even tighter result: virtual solar viewshed calculations within 1% of SunEye readings at the same site, and up to 30% more accurate than shade reports derived from satellite imagery and LiDAR alone (Scanifly, 2023). Drone analysis costs more per site but is the most defensible option for complex or heavily-vegetated roofs.
Satellite-only analysis without LiDAR is appropriate for pre-qualification screening — ruling out obviously unsuitable sites before investing in a full design. It should not be submitted to lenders or incentive administrators on tree-heavy sites where canopy height errors directly affect Solar Access calculations.
Pro Tip
When a program requires an “on-site” shade tool, verify which tools it approves by name. MassCEC accepts Solmetric SunEye, Solar Pathfinder, Scanifly, Aurora (with LiDAR), and Bright Harvest. RI REF adds HelioScope and OpenSolar to that list. (Sources: MassCEC Technical Requirements; RI REF Minimum Technical Requirements, 2023)
What makes a report bankable? A bankable shade report is one generated by a tool that an incentive administrator or lender has formally accepted as accurate enough to back financial commitments — rebate applications, production guarantees, or loan underwriting. Aurora’s shade reports are accepted by NYSERDA, MassCEC, NJ Clean Energy Fund, Oncor, and Sunnova (Aurora Solar, 2024-04-05). Bankability is program-specific. A report that satisfies NYSERDA may still need supplemental on-site verification for a specific private lender. Always pull the current approved-tool list from the program administrator before running the final report — tool lists are updated periodically.
Incentive Thresholds by Program: What TSRF Score You Need
Before signing a proposal, confirm which incentive programs apply and check their exact TSRF floor. The threshold varies across programs — and so does whether the program measures the worst-performing module, the plane average, or the capacity-weighted system average.
| Program | Min. TSRF | Measurement Method | Penalty Below Threshold | Approved Tools (Examples) |
|---|---|---|---|---|
| Energy Trust of Oregon (on-site) | 75% | Lowest point on array | Modules below 75% excluded from incentive (not full system) | SunEye, Solar Pathfinder, Scanifly |
| Energy Trust of Oregon (remote) | 80% | Plane average | Plane excluded from incentive | Aurora (LiDAR), HelioScope |
| NYSERDA NY-Sun | 80% | System average | Pro-rated: 70% TSRF = 70% of rebate dollar amount | Aurora, HelioScope, and others |
| MassCEC Mass Solar Loan | 70% | Weighted system average | Below 70% = application denied | SunEye, Pathfinder, Aurora (LiDAR), Scanifly, Bright Harvest |
| Rhode Island REF | 80% | Mean of 4 corners per array | Project ineligible | SunEye, Solar Pathfinder, HelioScope, Aurora |
| Oncor Texas Solar Program | N/A — uses Solar Access % | Annual unshaded percentage | Required for IA approval — no published floor | Shading study (no specific tool mandated) |
(Sources: Energy Trust program requirements #10, #11; NYSERDA program manual, 2017; MassCEC Technical Requirements; RI REF Minimum Technical Requirements, 2023; Oncor Solar Program Manual, 2024)
The 80% threshold that NYSERDA and RI REF share did not emerge from a single study. It was established to ensure economic feasibility, originally proposed by a consortium of industry experts including NREL and later adopted across multiple state programs (Energy Trust Cadmus review). Some programs pushed it lower — MassCEC set 70% as its minimum to keep more projects eligible while still screening out the worst sites.
Oncor is the important exception. Oncor’s solar program does not use TSRF at all. The program manual explicitly instructs installers not to use TOF or TSRF values in the submission — it requires Solar Access % only, stated as the annual unshaded percentage (Oncor Solar Program Manual, 2024). If you submit a TSRF figure to Oncor instead of Solar Access %, your interconnection agreement will be returned for correction.
NYSERDA pro-rating explained: If a system comes back at 72% TSRF for a NYSERDA NY-Sun project, installation can proceed — but the incentive is reduced proportionally. A system that would have earned $5,000 at 80%+ TSRF earns roughly $4,500 at 72% TSRF (72% ÷ 80% × $5,000). Confirm the current formula with your program administrator before quoting a dollar figure to the customer; the program manual language on pro-rating dates to 2017 and the dollar-per-watt incentive may have been updated since (NYSERDA program manual, 2017).
Energy Trust of Oregon has the most installer-friendly structure: modules that fall below 75% TSRF are not disqualified from the project — they are simply excluded from the incentive-qualifying area. So a 10-module array where 2 modules sit below 75% can still earn incentive on the other 8, provided those 2 are electrically isolated using microinverters or another pre-approved technology (Energy Trust solar requirements).
How to Interpret the Monthly Solar Access Chart
Every shade report includes a 12-bar chart showing Solar Access % for each calendar month. It is the most informative and most-ignored section of the report. Annual TSRF tells you if you qualify for an incentive. The monthly chart tells you what to tell the homeowner in January.
The bars follow a predictable pattern in most locations. December and January are shortest — the sun sits lower in the sky during winter, so shadows from trees, chimneys, and roofline parapets extend further across the array. Summer months typically show the tallest bars, when high sun angles minimize obstruction shadows.
Three steps for reading the monthly chart:
-
Identify the lowest month. If it falls more than 15 percentage points below the annual average, investigate the obstruction. A single month dipping from 88% annual average to 60% in December suggests a tree or structure that only blocks the low-angle winter sun.
-
Check whether the drop is winter-only or year-round. Winter-only dips usually indicate deciduous tree shadows — a species that drops leaves will cast longer bare-branch shadows in winter than in summer, but canopy shadows in spring and fall. A year-round dip of consistent depth suggests a permanent structure: chimney, HVAC unit, neighboring building.
-
Cross-reference the lowest monthly Solar Access with the annual TSRF. A system with 85% annual TSRF but 55% Solar Access in December may still qualify for most incentive programs on annual figures. But the homeowner needs to understand that December output will be substantially lower — not because of a system problem, but because of geometry.
For designers: low-irradiance winter months affect string voltage. If monthly Solar Access in December–January drops below 60% on a long string, verify that remaining irradiance still keeps the string above the inverter’s minimum start voltage. A string that cuts out on cold, low-irradiance winter mornings will underperform the annual model prediction.
For sales reps: the homeowner framing is simple. “The bar chart shows how your roof performs month by month. The shorter bars in winter are normal — the sun is lower in the sky and shadows are longer. Your annual score is what the incentive program evaluates, and that number qualifies you.”
Pro Tip
If you see a sudden single-month dip in an otherwise consistent chart, check whether a seasonal obstruction — a holiday decoration, HVAC equipment repositioned seasonally, or a temporary shade structure — was present during the site survey. Re-run the report once the obstruction is removed.
TSRF Decision Tree: What to Do at Each Band
TSRF is not just a pass/fail score. It is a design instruction. Each band has a different action set for the designer, a different BOM implication, and a different conversation with the homeowner.
TSRF ≥85% — Proceed with Standard Design
The roof is in the top tier. Minimal shading, good orientation — a standard string-inverter design is appropriate on shading grounds alone.
BOM implication: string inverter is the right choice. No MLPE required for shading reasons (though the designer may still consider optimizers for other reasons, such as module-level monitoring or roof-angle mixing).
String sizing note: group modules with similar Solar Access % on the same MPPT channel. Even at high system TSRF, mixing modules from a 98% Solar Access south plane with modules from a 90% Solar Access east plane on the same string leaves production on the table. For more on this topic, see String Sizing Solar PV System.
Sales script: “Your roof scores in the top tier for sun exposure. You qualify for the full incentive and your payback stays on track. Standard design is the right call here.”
TSRF 75–85% — Qualify, with Minor Adjustments
The system qualifies for Energy Trust of Oregon on-site (75% floor), NYSERDA at full or slightly reduced rate (80% floor), and most other programs. The work at this band is in the plane-level detail.
BOM implication: if any individual module group drops below 75% Solar Access, isolate it with a power optimizer or microinverter to protect string production. The affected modules will still produce — they will not pull down unshaded modules on the same MPPT.
Designer note: pull the monthly chart and verify winter months. If December–January Solar Access on any string drops below 60%, check string voltage at those irradiance levels against the inverter’s MPPT window.
Sales script: “Your sun score is solid — you qualify for the full state rebate. We may add module-level electronics on the section near the chimney so that one panel does not pull down the rest. Net impact on production is minimal and the quote reflects it.”
If the system comes in at 76–79% TSRF on NYSERDA, be transparent with the customer about the pro-rating before the application is submitted. A $200 reduction in rebate is much easier to explain before signing than after.
TSRF 70–75% — Borderline Incentive Eligibility
MassCEC passes at 70% weighted average. Most other programs require 75%+. This is the band where mitigation decisions produce the highest financial return.
Mitigation options, in priority order:
- Tree trimming or removal. Document with a before/after shade report for incentive applications. A qualified arborist’s work order plus a re-run of the shade report after trimming is the cleanest path to clearing the 75% floor.
- Reorient array to a higher-TOF plane. If the east face scores 72% TSRF and the south face scores 84%, moving the array may be structurally feasible and eliminates the incentive eligibility issue entirely.
- Isolate the lowest-TSRF modules on microinverters. They will not count toward the incentive-qualifying area but they will stop pulling down the rest of the string. This is the right call when trimming is not possible and relocation is not feasible.
Generation and financial tool: when running the 70–75% scenario, use the generation and financial tool to model payback both with and without the incentive. Some projects at this band make sound financial sense even without a rebate — the homeowner should see both numbers before deciding on mitigation.
Sales script: “We’re right at the edge for the state rebate. I recommend two options: trim the oak branch on the south side, or we upgrade to optimizers so the shaded panels do not pull down the rest. Let me show you what each path does to the 10-year payback.”
If mitigation is not feasible and the project falls below every applicable incentive floor, drop the below-threshold modules and resize the system to the unshaded area. A smaller, fully-qualifying system often outperforms a larger system that misses the incentive.
TSRF Below 70% — Redesign or Decline
At this band, most incentive programs are off the table and microinverters or power optimizers are strongly advisable for any remaining modules. The designer’s job is to define what a viable system looks like on the unshaded portions of the roof — not to force panels onto a heavily shaded plane.
Mitigation options:
- Arborist assessment for selective pruning or full removal. The ROI on tree removal for solar access can be positive when the value of recovered production over 25 years exceeds the removal cost — model this explicitly.
- Ground-mount alternative. If the roof is persistently shaded, a ground-mount on a clear section of the property may be the right answer.
- Repower with higher-wattage modules on the unshaded area to hit the target offset with fewer modules.
- If the homeowner insists on using the shaded plane, exclude it from the production guarantee scope, document that decision in writing, and install microinverters so the shaded plane does not impair the rest of the system.
Sales script: “This section of roof gets significant shade. We have three paths: remove the tree, move the panels to the garage roof, or accept lower production here with microinverters. Let me show you the numbers on each — the right choice depends on what makes sense financially.”
Even at sub-70% TSRF, the project may still pay back without an incentive. The solar design software calculates payback across scenarios — show the homeowner the three-path comparison and let the numbers make the case. Read more about Floating Solar Farms France.
Pro Tip
Always re-run the shade report AFTER tree trimming or any mitigation work. Lenders and incentive programs require the as-installed report — not the pre-mitigation version. A before/after report pair also supports the production guarantee scope definition.
Inverter Topology and Shading: String vs. MLPE
String inverters have a well-understood weakness with partial shading. In a series circuit, all modules share the same current. One shaded module — even a module at 85% Solar Access — limits the entire string’s output to the shaded module’s maximum power point. An unshaded 400 W panel connected in series with a 50%-shaded 400 W panel does not produce 600 W. It produces closer to 400 W, because both modules are throttled to the shaded panel’s operating point (arXiv microinverter paper, 2020).
NREL’s shading test protocol quantifies how much this costs in practice (cited via PretaPower, 2025):
| Shading Condition | String Inverter Impact | Microinverter Impact | Energy Gain from MLPE |
|---|---|---|---|
| Light shade | Entire string affected | Affected panel only | +3.7% |
| Moderate shade | Significant string loss | Isolated impact | +7.8% |
| Heavy shade | Severe string degradation | Minimal system impact | +12.3% |
(Source: NREL shading-test protocol, cited via PretaPower, 2025-10-30)
A real-world case study from Anern shows the pattern in residential numbers: an 8 kW system with east/west-facing planes plus chimney shading produced 9,920 kWh/year on a string inverter. The same system with MLPE power optimizers produced 10,750 kWh/year — a gain of 830 kWh/year (+8.4%) (Anern case study, 2025-09-03).
At $0.173/kWh average U.S. residential retail electricity rate (EIA Electric Power Monthly, 2025), 830 kWh/year recovered equals $143.59/year in additional value. Over 25 years undiscounted, that is $3,590. Compare that figure against the optimizer cost premium when deciding whether MLPE is justified on a partially shaded string.
Power optimizers sit between string inverters and full microinverters in both cost and performance. They capture approximately 80–90% of the microinverter benefit at string inverter economics — single AC conversion point, lower component count, but panel-level MPPT that stops a shaded module from pulling down its neighbors (Solar Permit Solutions, 2026-02-07). For most residential shading situations where 1–3 modules are affected, optimizers are the right call. Full microinverters make sense when shading is heavy across multiple planes or when panel-level monitoring is a strong sales point with the customer.
One clarification worth making to homeowners: a power optimizer does not eliminate shading loss on the affected module. The shaded module still produces less. The gain is in protecting the unshaded modules — they continue operating at their own maximum power point rather than being pulled down to the shaded module’s level.
BOM decision rule:
- TSRF ≥85% and plane-level Solar Access variance is low: string inverter is the right choice.
- Any plane or module group at 70–85% TSRF: add power optimizers to that string segment.
- System-level TSRF below 70%, multiple shading sources, complex multi-plane roof: microinverters on the affected plane(s).
Sales-Call Scripts for Every ICP
The same shade report needs to be explained differently depending on who is in the room. A designer reading this section can skip ahead to the homeowner scripts — the BOM material above covers the design decisions.
For the Installer / Designer
The shade report is a string-topology instruction, not just a compliance document. Plane-level TSRF dictates which modules go on which MPPT channel. The rule: never mix modules with high and low Solar Access % on the same MPPT input. A string combining a 98% Solar Access south-plane module with an 82% Solar Access east-plane module will operate at the lower module’s power point on cloudy or low-irradiance mornings.
Quote-stage discipline matters here. If any plane is below 75% TSRF, price in MLPE before submitting the proposal. Revising the BOM after the customer has seen a string-inverter price creates friction and erodes trust. The first quote should reflect the correct design.
When working in a solar design platform that links shading data to the electrical BOM, the string/optimizer recommendation can be automated — no manual cross-referencing between the shade report PDF and the design tool. That automation is where most of the time savings in proposal turnaround come from.
For the Sales Rep
The homeowner does not need to understand the formula. They need to understand what the number means for their wallet and their incentive eligibility.
30-second TSRF script (from dossier, adapted):
“Your roof scores 88% TSRF. That means it captures 88% of the absolute best-case sun at your address. Anything above 80% is excellent — you’re well above the cutoff for the state rebate and your payback stays on track. The one number to watch is the 82% on the northeast section. We’ll use an optimizer there so it doesn’t slow down the rest.”
Objection: “Why is panel 7 only 81%?”
“That’s the panel closest to the chimney. At 81% it’s still producing — but in a string circuit, a weaker panel can limit the others. The optimizer gives that panel its own maximum power point tracking so the rest of the roof keeps producing at full speed.” For more on this topic, see Solar Racking Design Guide.
Generate solar proposals that embed the shade visualization directly — so the homeowner can see the same 3D model the designer used, not just a static PDF with three numbers they cannot interpret on their own. The conversation changes when the customer can rotate the model and see why panel 7 reads 81% at 3 PM in December.
For the Homeowner Reviewing a Quote
Three numbers to look for on any shade report PDF:
- TSRF — the overall score. Above 75–80% means you likely qualify for incentives. Below 70% means ask the installer for mitigation options before signing.
- Solar Access % — the shade number. Below 85% means something is blocking sun. Ask what it is and whether trimming or removing it would push the number higher.
- Monthly Solar Access bar chart — big drops in winter months are normal; shorter days and lower sun angles shrink the bars every year. Drops in spring or summer months are worth questioning.
If the installer shows you only the annual TSRF headline, ask to see the monthly breakdown and the plane-level breakdown. You want to know which roof section is weakest and whether it affects your incentive eligibility. Understanding your roof’s solar potential starts with accurate solar shadow analysis software that shows you the detail, not just the summary.
Common Mistakes When Reading a Shade Report
These seven mistakes account for most of the production shortfalls, incentive denials, and homeowner disputes we see on shade-related projects.
-
Confusing Solar Access % with TSRF. Solar Access measures shade only. TSRF folds in orientation. A south-facing roof with no trees can have 100% Solar Access but 94% TSRF because it is pitched at 10° instead of the optimal 30°. Oncor’s program uses Solar Access %; NYSERDA uses TSRF. Submitting the wrong metric to an incentive program causes rejection and delays the interconnection agreement. (Sources: Oncor, 2024; Aurora Solar, 2024)
-
Accepting a satellite-only report on a tree-heavy site. Satellite-only shade analysis without LiDAR can miss tree canopy height, leading to overestimated Solar Access. NREL’s Aurora validation showed that LiDAR improves accuracy from ±5 SAV to ±3 SAV (NREL #65558, FY2016). A 2-point SAV error on a borderline site can push a 77% TSRF above the 75% incentive floor on paper — and below it in practice once the system is running.
-
Reading only the annual headline and ignoring planes. An 82% system TSRF can mask a single plane at 68% pulling down an otherwise clean roof. Pull every plane, not just the system summary. A string running across that 68% plane needs MLPE before the quote goes out.
-
Not checking the program’s current approved-tool list. Programs update their approved tools periodically. A shade report generated by a tool accepted last year may not be accepted by this year’s updated program manual. Pull the current list from the administrator before running the final report.
-
Assuming string inverter is acceptable because annual TSRF is 78%. A 78% system TSRF with a 65% worst-plane TSRF still needs MLPE on that string. The annual headline hides the worst-module problem. Look at the module-level Solar Access breakdown before finalizing inverter topology.
-
Not re-running the report after tree trimming. If mitigation work was performed, a new shade report is required for incentive documentation. Submitting the pre-mitigation report to support a post-mitigation system does not meet program requirements. The before/after pair also strengthens the production guarantee scope definition.
-
Handing the PDF to the homeowner without context. Most homeowners cannot parse Solar Access vs. TSRF from a raw table. Presenting the numbers without a verbal walkthrough leads to production-shortfall disputes in winter months and potential chargebacks when the homeowner compares actual bills to the proposal estimate.
Conclusion
Reading a shade report is not a passive activity. The three numbers — Solar Access, TOF, and TSRF — tell the designer what topology to spec, tell the sales rep what to say on the call, and tell the homeowner what to expect month by month. Getting any one of those three communications wrong creates downstream problems that shade reports exist to prevent.
Three concrete actions to take after reading any shade report:
-
Check TSRF against your specific incentive program’s minimum — not the generic 80% rule. Energy Trust of Oregon requires 75% (on-site) or 80% (remote). NYSERDA pro-rates below 80%. MassCEC accepts 70% weighted average. Oncor does not use TSRF at all. The program administrator’s current documentation is the only authoritative source.
-
Pull the plane-level breakdown, not just the annual headline. Flag any plane or module group below 75% Solar Access and price in MLPE before the proposal goes out. Revising the BOM after the homeowner has seen a string-inverter price is harder than getting it right the first time.
-
Walk the homeowner through the monthly bar chart. It sets accurate winter expectations, avoids production-shortfall disputes in year 1, and is the conversation that differentiates an installer who understands the data from one who hands over a PDF and hopes for the best.
If you are designing systems in a tool that generates the shade report separately from the proposal, you are adding a manual translation step that loses customers. SurgePV’s cloud solar design tool connects shading data directly to the proposal and the BOM — so the rep walks into the sales call with everything in one place, and the homeowner sees the 3D model that explains the numbers rather than a PDF they cannot interpret. Book a 20-minute walkthrough at surgepv.com/demo to see how it works on a live project.
Frequently Asked Questions
What is TSRF in solar?
Total Solar Resource Fraction (TSRF) is the ratio of actual solar insolation available at a specific roof plane — accounting for both shading and tilt/orientation — compared to the maximum possible insolation at that location with zero shade and perfect orientation. It is calculated as TSRF = Solar Access % × Tilt and Orientation Factor (TOF). A TSRF of 88.2% means the roof captures 88.2% of the absolute best-case irradiance available at that address. Most incentive programs set a minimum of 75–80% TSRF as an eligibility floor. (Sources: HelioScope, 2025; Energy Trust Cadmus review)
What is a good TSRF percentage?
A TSRF above 85% is excellent — the roof has minimal shading and is well-oriented, and standard string inverter design is appropriate. A TSRF of 75–84% is good and qualifies for most state incentive programs, though individual module groups below 75% may need power optimizers. A TSRF of 70–74% is marginal — MassCEC’s Mass Solar Loan passes at 70% weighted average, but most other programs require 75%+. Below 70%, the project needs mitigation (tree trimming, panel relocation, or MLPE) before qualifying for most incentives. (Sources: Energy Trust program requirements; MassCEC Technical Requirements; Sunbridge Solar, 2024)
What makes a shade report “bankable”?
A bankable shade report is one generated by a tool that an incentive administrator or lender has formally accepted as accurate enough to support financial commitments — such as rebate applications or production guarantees. Bankability is program-specific, not a universal label. Aurora Solar’s shade reports are accepted by NYSERDA, MassCEC, NJ Clean Energy Fund, Oncor, and Sunnova. A report that qualifies for one program may still need supplemental on-site verification for a different lender. (Source: Aurora Solar blog, 2024-04-05)
How accurate is remote shade analysis?
Remote shade analysis tools that use LiDAR data are statistically equivalent to on-site SunEye measurements within ±3–5 SAV per NREL validation studies. An NREL study of Aurora Solar found annual solar access values within ±5 SAV of SunEye readings in Los Angeles and Denver; with LiDAR available, accuracy improved to ±3 SAV. Drone-based on-site analysis is closer still — Scanifly reports its virtual solar viewshed calculations are within 1% of SunEye readings. Satellite-only analysis without LiDAR has wider variance and may not meet program requirements on tree-heavy sites. (Sources: NREL #65558, FY2016; Scanifly, 2023)
Can you get solar if your TSRF is below 75%?
Yes — a low TSRF does not prevent installation, but it may reduce or eliminate eligibility for certain incentive programs. MassCEC’s Mass Solar Loan accepts a weighted system TSRF of 70%, and NYSERDA pro-rates incentives below 80% rather than cutting them off entirely. Mitigation options — tree trimming, panel relocation to a higher-TSRF plane, or switching to microinverters or power optimizers — can raise effective TSRF before the final report is submitted. If mitigation is not feasible, a system can still be installed and may still pay back over time; calculate payback with and without the incentive so the homeowner can make an informed decision. (Sources: MassCEC Technical Requirements; NYSERDA program manual, 2017; Energy Trust Cadmus review) Solar proposal software generates professional quotes in minutes.