Quick Answer
The average solar cost per lead is around $206 (Clean Energy Experts, 2024). Multiply that by 100 leads for a 6-install month and you have spent $20,600 before a single system ships. Highest intent; requires systematic ask Organic SEO / inbound. $30–$80. 12–20%. Slower to build; compounds over time Paid search (Google). $150–$350. 8–14%.
94 out of 100 solar leads never become customers. That is not a product problem — SurgePV sells on a clean, competitive platform. It is a process problem. The average cost per solar lead is around $206 (Clean Energy Experts, 2024), customer acquisition cost is projected to reach $0.84/W for residential in 2026 (Wood Mackenzie, 2025), and buyers comparing quotes do most of their evaluating within 24 hours of first contact. A team that responds in under a minute is far more likely to qualify that lead — the MIT/InsideSales Lead Response Management Study found that companies contacting leads within 5 minutes are 21× more likely to qualify them versus waiting 30 minutes (InsideSales / MIT, 2007). A team without a defined handoff from design to proposal hands the sale to a faster competitor.
The average solar cost per lead is around $206 (Clean Energy Experts, 2024). Multiply that by 100 leads for a 6-install month and you have spent $20,600 before a single system ships. Highest intent; requires systematic ask Organic SEO / inbound.
This guide maps the exact seven steps from first contact to energized system. Each step includes a benchmark duration, the most common slowdown, and the fix that high-performing teams apply. The math at the end shows what optimizing just three leak points does to your annual revenue.
TL;DR — The 7-Step Solar Sales Process
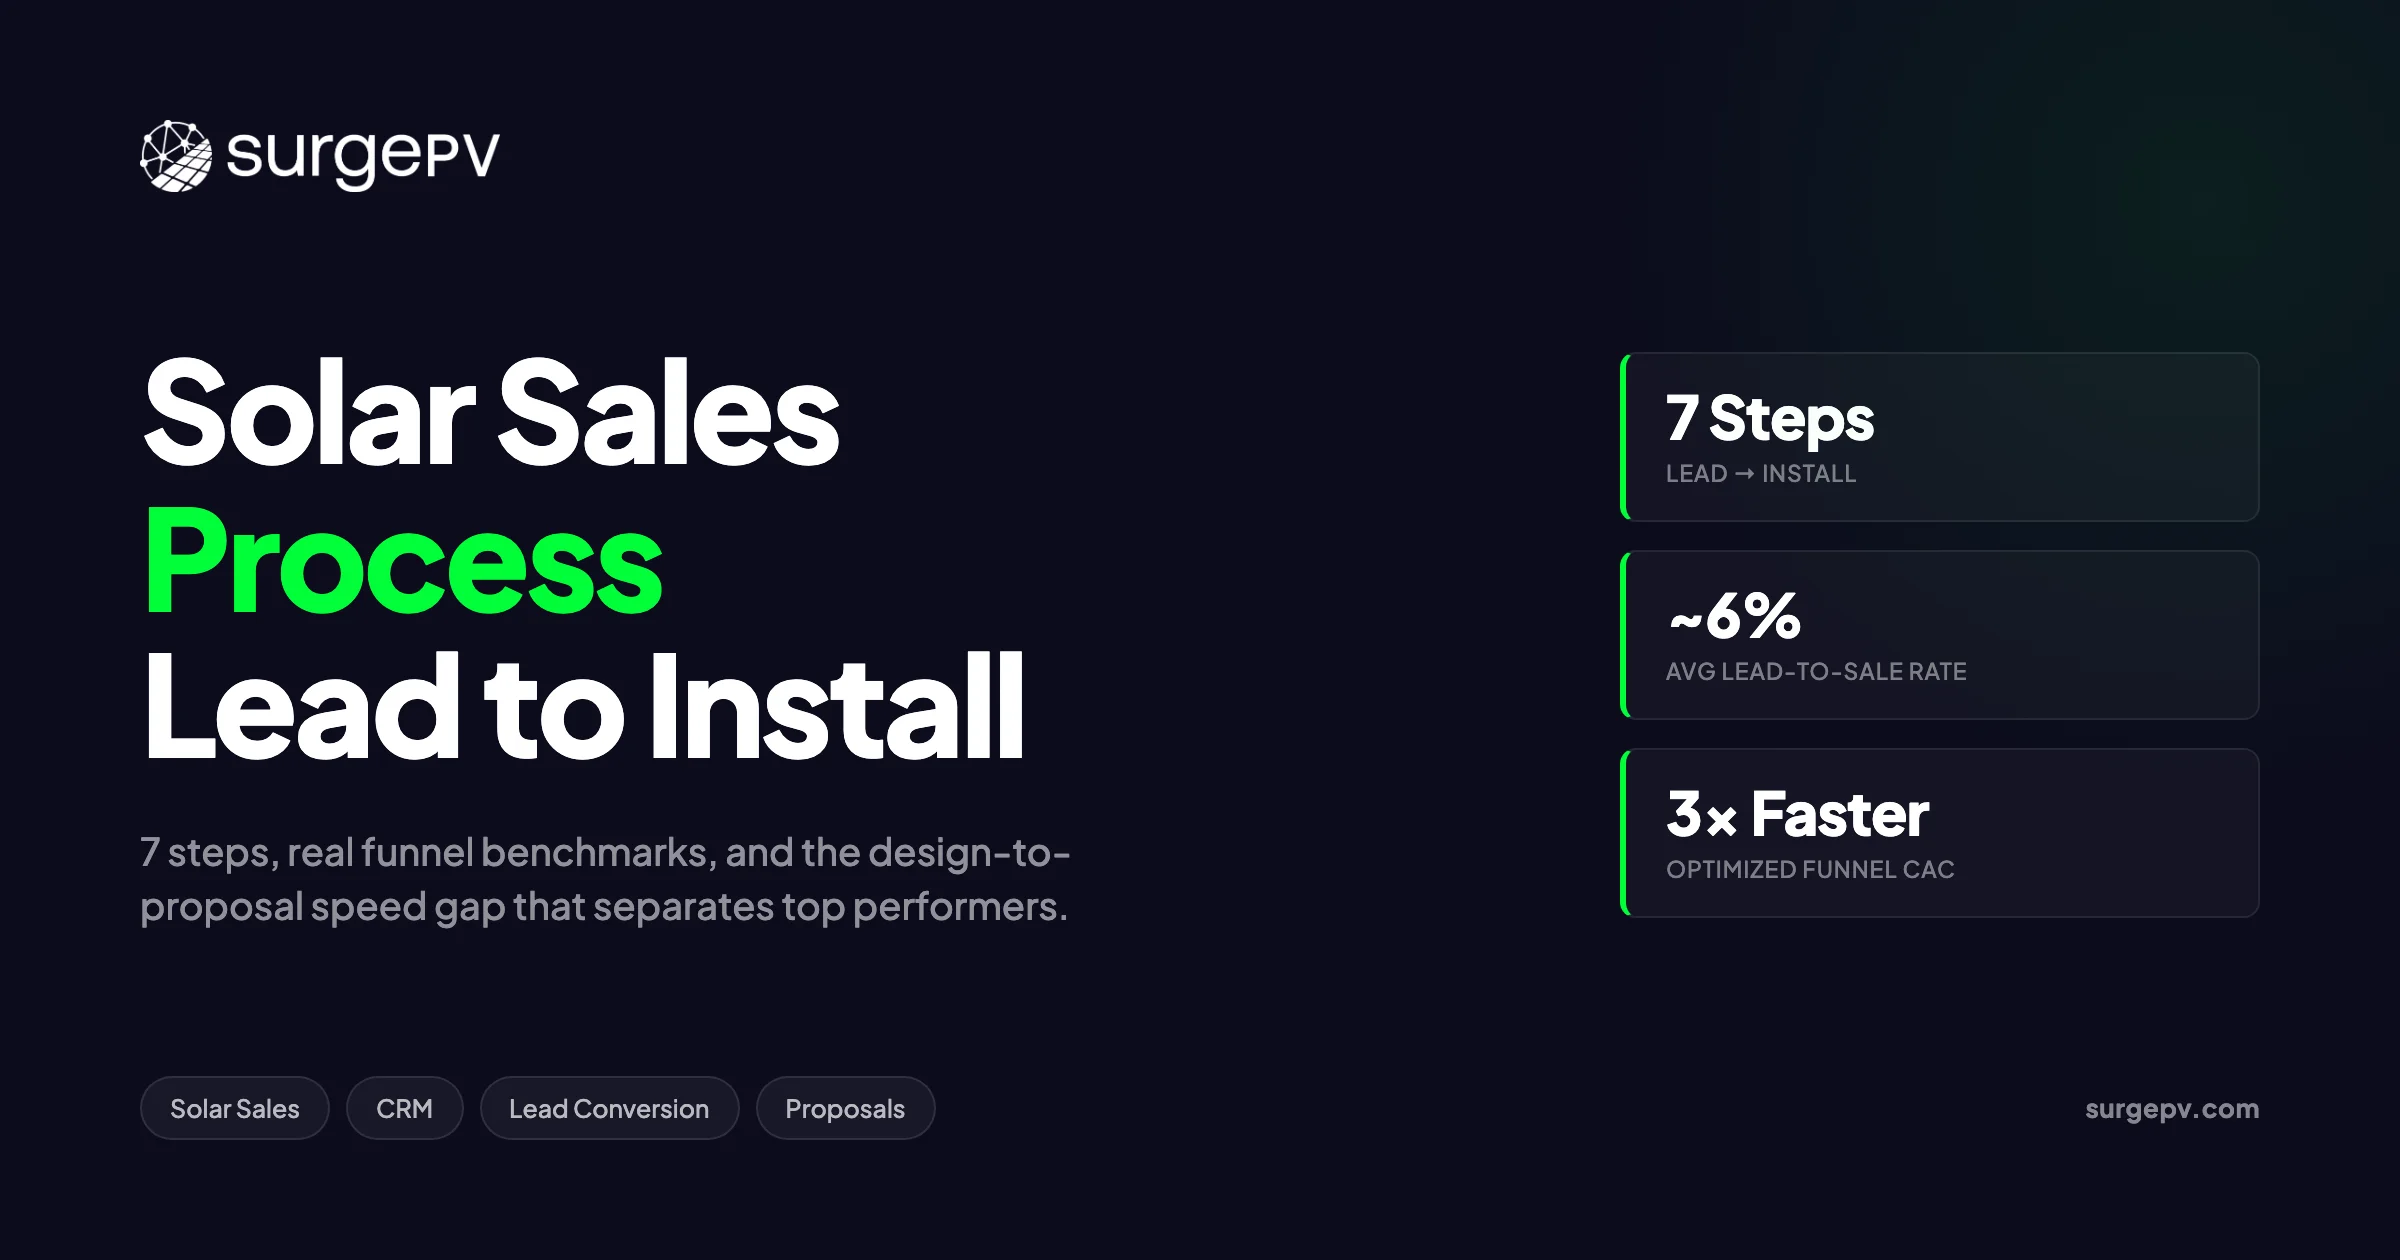
Lead generation → qualification → site assessment → system design → proposal → close → install handoff. Industry-observed close rates typically run around 6% of all leads for average teams. Speed is the biggest lever: the MIT/InsideSales Lead Response Management Study found that companies contacting leads within 5 minutes are 21× more likely to qualify them versus waiting 30 minutes (InsideSales / MIT, 2007), and industry data consistently shows the first company to respond wins the majority of competitive situations. Cut design-to-proposal time to under 4 hours and you double that advantage.
In this guide:
- What the solar sales process is and why most teams underperform it
- Step 1: Lead generation — channel comparison and auto-assignment
- Step 2: Initial qualification — the 4-factor filter and 5-question script
- Step 3: Site and energy assessment — on-site vs. remote and what kills the deal
- Step 4: System design and simulation — the 3–7 day queue problem and how to fix it
- Step 5: Proposal and financial modeling — winning checklist and ITC rules
- Step 6: Close — the 5 most common objections and e-signature timelines
- Step 7: Install handoff and post-install — referral ask and monitoring setup
- The 100-lead funnel with average vs. optimized math
- CRM and tooling recommendations for each team size
What Is the Solar Sales Process?
The solar sales process is the structured sequence of steps a solar company follows to convert a prospective customer — from initial contact through signed contract to completed installation. It covers lead generation, qualification, site assessment, system design, financial proposal, close, and post-install handoff.
Most residential sales cycles run 4–10 weeks. Commercial cycles run 3–18 months. The steps are largely the same; what changes is the complexity of each phase and the number of stakeholders involved. Without a documented process, individual reps invent their own sequences, handoffs fail between sales and operations, and the team has no consistent baseline to improve from.
Step 1: Lead Generation
Where your pipeline begins — and where most of the cost accumulates.
The average solar cost per lead is around $206 (Clean Energy Experts, 2024). Multiply that by 100 leads for a 6-install month and you have spent $20,600 before a single system ships. Channel mix determines both your CPL and your downstream close rate, because not all leads convert at the same rate.
Solar Lead Channel Comparison
| Channel | Avg. CPL | Close Rate | Notes |
|---|---|---|---|
| Referral | $50–$150 | 20–30% | Highest intent; requires systematic ask |
| Organic SEO / inbound | $30–$80 | 12–20% | Slower to build; compounds over time |
| Paid search (Google) | $150–$350 | 8–14% | Fast volume; CPL rises in competitive markets |
| Lead aggregators | $200–$400 | 4–8% | Shared leads; speed-to-contact is critical |
| Door-to-door (D2D) | $20–$60 per contact | 3–7% | High volume, low per-unit cost, time-intensive |
| Utility partner programs | Variable | 15–25% | Pre-qualified intent; limited availability |
Referral leads close at 3–5× the rate of aggregator leads and cost a fraction of the price. Yet most solar companies do not run a formal, systematized referral program — the majority rely on a casual “tell your neighbors” conversation that produces inconsistent results.
For aggregator and paid leads, the single biggest driver of conversion is response time. The MIT/InsideSales Lead Response Management Study found that companies contacting leads within 5 minutes are 21× more likely to qualify them versus waiting 30 minutes (InsideSales / MIT, 2007). Response times beyond 5 minutes see conversion drop sharply, and industry data consistently shows the first company to respond wins the majority of competitive situations.
Pro Tip
Set up an automatic SMS within 60 seconds of a lead form submission. The message should confirm receipt, set an expectation (“we’ll call in the next few minutes”), and include your rep’s first name. This one change reduces cold-lead dropout significantly before a human call is made.
Common Lead Generation Slowdown
New leads sit in a shared inbox or CRM queue with no owner. Reps cherry-pick the warm ones. Cold leads age past the qualification window within hours.
Fix: Auto-assign every lead to a named rep at the moment it enters the CRM. Set a response SLA of 60 seconds for aggregator and paid leads. Track response time as a team metric alongside close rate.
For teams building their lead pipeline through content and SEO, the for solar sales professionals page covers inbound channel strategies specifically for installer-led sales teams.
Step 2: Initial Qualification
Speed got the conversation started. Qualification decides whether you invest another hour.
A poorly qualified lead that reaches site assessment costs a rep 90–120 minutes of field time and a company $200–$400 in loaded cost. Running a structured 5-minute pre-qualification before booking a site visit eliminates 30–40% of that waste.
The 4-Factor Qualification Filter
| Factor | Minimum Threshold | Why It Matters |
|---|---|---|
| Monthly electricity bill | $80+ residential / $500+ commercial | Below this, payback period extends beyond typical loan terms |
| Roof condition and age | Under 15 years old; no major damage | Roof replacement before install destroys the deal economics |
| Ownership status | Owner-occupied (or landlord approval) | Renters cannot sign a solar contract without landlord consent |
| Credit / financing eligibility | 640+ FICO for most loan products | Cash buyers bypass this; for financed deals, a failed credit check collapses the sale at close |
Skipping qualification is the second most common sales process failure — after slow response times. Teams that qualify thoroughly see their site-assessment-to-proposal conversion rate run 10–15 percentage points higher than teams that book every warm conversation.
The 5-Question Pre-Survey Script
Send this as a text or email sequence before booking the site visit:
- What is your average monthly electricity bill?
- Do you own your home or are you the property owner?
- Roughly how old is your roof?
- Are there large trees or obstructions shading your roof?
- Are you looking at cash purchase, loan, or lease options? Read [Solar Shading Analysis Guide](/blog/solar-shading-analysis-guide) for a complete walkthrough.
Answers to these five questions let you score the lead before committing field time. A homeowner paying $80/month with a 20-year-old roof and trees covering the south face is not a no — but it flags two issues to address before the site visit.
What Happens to Unqualified Leads?
Mark them as “disqualified — reason” in your CRM, not just “closed lost.” Reasons accumulate into data. After 6 months you will see whether bill threshold or financing eligibility is your biggest filter — and can adjust channel mix accordingly.
Common Qualification Slowdown
The team skips qualification because “every lead deserves a site visit.” Close rates run below 5% because the funnel is full of unqualified contacts.
Fix: Require the 5-question pre-survey before any site visit is booked. Set a minimum bill threshold in your CRM as a required field. Report qualification rates by lead source monthly.
Step 3: Site and Energy Assessment
The site assessment is where the sale either accelerates or dies. A qualified lead who gets a thorough, professional assessment converts at 2× the rate of one who gets a rushed walkthrough.
There are two assessment models: on-site and remote. Each has its place.
On-Site vs. Remote Assessment Comparison
| Factor | On-Site | Remote |
|---|---|---|
| Shading accuracy | High — can physically measure obstructions | Moderate — depends on satellite/LIDAR data quality |
| Roof condition check | Complete — rep sees the roof | Limited — relies on imagery |
| Relationship building | High — face-to-face interaction | Low |
| Cost per assessment | $150–$300 loaded (industry-observed range) | $30–$80 (industry-observed range) |
| Best use case | Residential, complex commercial | Pre-qualification, commercial preliminary |
For residential sales, the on-site assessment remains the standard. For commercial pre-qualification or high-volume residential markets, a remote desktop assessment using satellite imagery can filter sites before committing field time.
The 45-Minute On-Site Walkthrough
A structured walkthrough covers eight checkpoints:
- Roof pitch and orientation (south-facing in northern hemisphere, north-facing in southern)
- Usable roof area and obstructions (HVAC, skylights, dormers)
- Shading from trees, chimneys, neighboring structures
- Roof age and material (asphalt, tile, metal — affects mounting system and permit requirements)
- Electrical panel capacity and location (200A service minimum for most modern systems)
- Main service panel upgrade requirement (MSP upgrade adds $1,500–$3,000 to project cost)
- Utility meter location and interconnection point
- Internet or cellular connectivity for monitoring Also see: Us Residential Solar Market Trends 2026. See Solar Racking Design Guide for detailed guidance.
Shading Is the Most Common Assessment Blind Spot
Research on urban solar potential assessment consistently shows that traditional 2D and visual methods underestimate shading losses — one peer-reviewed study found that 2D rooftop assessments overestimate solar potential by more than 17% in dense urban environments due to unaccounted inter-building shading effects (ScienceDirect, 2025). Use physics-based shading simulation — not just a quick visual — before committing to a production estimate. The solar shadow analysis software at SurgePV runs irradiance and obstruction modeling on a cloud-rendered 3D model so you have defensible numbers before the proposal.
Two deal-killers often surface at this step: roof pitch outside the ±2° tolerance that some mounting systems require a structural engineering review for, and interconnection surprises — discovering the utility requires a transformer upgrade or a smart inverter for the circuit. Both add cost and timeline. Surface them at assessment, not after the contract is signed.
Common Site Assessment Slowdown
Reps take handwritten notes on paper forms or photos in a personal phone. Data doesn’t make it into the CRM. Design queue gets a half-complete site package.
Fix: Use a digital survey form integrated with your CRM — even a simple form that pushes data and photos to the project record on submit. Design starts with a complete package instead of a follow-up call to clarify roof pitch.
Step 4: System Design and Simulation
System design is where most solar teams lose deals they should win. Industry-observed timelines place the average gap from completed site assessment to delivered proposal at 3–7 days. Your fastest competitor runs it in under 4 hours. That gap is where leads go cold.
The design step has three jobs: size the system correctly, model production accurately, and produce a design file that feeds directly into the proposal without re-entry.
The 6-Step Design Workflow
- Import site data (address, roof geometry, orientation, pitch) from the assessment form
- Model the 3D rooftop and place modules to maximize usable area
- Run shading simulation across the year — not just peak summer hours
- Size the inverter and strings against the module layout and DC/AC ratio
- Simulate annual energy yield against local irradiance data
- Generate the bill of materials (BOM) and send to the proposal workspace For United States-specific compliance details, see United States arizona/phoenix. For United States-specific compliance details, see United States california/los-angeles.
Steps 1–6 should run without switching tools. Every handoff between software — exporting a PDF from one platform and uploading it to another — adds 20–40 minutes and introduces transcription errors.
Design Time Benchmark
| Approach | Avg. Design Time | Error Rate |
|---|---|---|
| Manual CAD + separate simulation tool | 3–7 days (queue) | High — data re-entry errors |
| Solar-native design tool (integrated) | 2–4 hours | Low — single data source |
| SurgePV integrated workspace | Under 1 hour | Very low — site data flows directly to design |
What the Live Design Call Changes
The most effective technique in residential solar sales is completing a preliminary design on a screen-shared or tablet-shown call during the site assessment or a follow-up call the same day. When a customer sees their roof with modules laid out, production numbers calculating in real time, and a payback figure appearing as you size the system, the proposal stops being an abstract document they review later and becomes a conversation they participated in.
Solar design software that runs 3D rooftop modeling, module layout, string sizing, and simulation in one browser tab makes this possible. The shadow analysis layer resolves every shading question on the spot. Clara AI drafts proposal copy and financial summaries from the completed design, so the rep leaves the call with a near-complete document.
Pro Tip
Sales reps waiting on the design queue are the #1 cause of proposal delay. Train your top reps to run preliminary designs themselves using your solar design platform — not final engineering sign-off designs, but accurate-enough layouts to show production and payback. Reserve the design team for final permit-ready drawings.
Common Design Slowdown
Every proposal sits in a design queue shared by sales, operations, and engineering. A single complex commercial job can block 10 residential proposals behind it.
Fix: Separate the design workflow into two tiers. Tier 1 is a sales-grade preliminary design (rep-run, 30–60 minutes, used for proposal and close). Tier 2 is an operations-grade final design (engineering team, permit-ready). Only Tier 2 goes into the shared engineering queue.
Step 5: Proposal and Financial Modeling
The proposal is the last thing a buyer sees before they decide. A slow proposal loses to a fast one. An unclear proposal loses to a clear one. A proposal that can’t model multiple scenarios loses to one that can.
The Winning Proposal Checklist
A high-converting solar proposal contains eight elements:
- System summary — kW, module count, inverter brand, estimated annual production (kWh)
- Shading-adjusted production estimate — not just nameplate capacity
- Financial scenario table — cash, loan (15-year), loan (25-year) with monthly payment vs. current bill
- Payback and ROI — simple payback in years, IRR, NPV over 25-year life
- Incentive summary — current eligible incentives with exact amounts (see ITC rules below)
- Utility rate escalation assumption — the single biggest driver of long-term ROI
- Warranty summary — module, inverter, workmanship
- Next steps — a named action: “Schedule your design review call by [date]“
ITC and Incentive Rules — What You Can Claim
The 30% federal residential Investment Tax Credit expired December 31, 2025. You cannot quote this as available for homeowners signing contracts from January 1, 2026 forward.
For commercial projects, the IRA commercial investment credit (Section 48) may apply — but eligibility depends on prevailing wage requirements, domestic content, and energy community status. Verify on a case-by-case basis before quoting any commercial incentive figure.
ITC Hard Rule
Never include the 30% federal residential ITC in a proposal for a customer signing after December 31, 2025. Quoting an unavailable incentive creates a legal liability and destroys trust when the customer’s accountant corrects it. Check your proposal templates — many outdated tools still auto-populate the 30% figure.
Two Real Scenarios
US — 6 kW system, Phoenix, AZ (2026)
- System cost: $18,000 (~$3.00/W all-in)
- Annual production estimate: 9,000–9,500 kWh (GHI ~2,100 kWh/m²/yr for Phoenix per NREL NSRDB)
- Current electricity bill: $180/month ($2,160/yr at $0.18/kWh)
- 25-year loan payment: $95/month (at 6.99% APR — within the typical range for solar lenders in 2026; actual rates vary by credit score)
- Day 1 monthly savings: $85/month
- Simple payback (cash): 8.3 years
- No residential ITC available from 2026
UK — 5 kW system, London (2026)
- System cost: £9,500 (~£1,900/kWp all-in — within the typical UK installed range of £1,400–£2,200/kWp per HowToGoSolar, 2026)
- Annual production estimate: 4,000–4,500 kWh (GHI ~950–1,100 kWh/m²/yr for London per EU JRC PVGIS)
- Smart Export Guarantee rate: 15p/kWh exported (available from Octopus Energy, OVO, and E.ON Next as of 2026 per Sunsave, 2026)
- Bill offset at 60% self-consumption: ~£600/yr at the current Ofgem price cap rate of ~25p/kWh (Ofgem, April 2026)
- Simple payback: 10–12 years depending on self-consumption rate
The generation and financial tool at SurgePV runs both scenarios in the same workspace — energy yield, payback, IRR, and NPV — without leaving the proposal environment. For a direct comparison, see Arka 360 vs SurgePV.
The Open Rate Problem
A significant share of proposal emails go unopened. The customer agreed to receive a proposal, then life happened. The fix is not a better email subject line — it is pre-scheduling the proposal review call at the time of the site assessment.
“I’ll have your proposal ready Thursday. Can we walk through it together at 2 PM?” Books the call while you have attention. The solar proposal software at SurgePV generates a branded PDF with visuals and financials in one click — so you send the proposal 30 minutes before the call, not 3 days before.
Common Proposal Slowdown
Sales uses a separate Excel model for payback math, then screenshots the table into a Word document, then converts to PDF. Each step introduces errors and takes 2–4 hours.
Fix: Use an integrated workspace where the design simulation feeds directly into financial modeling and the proposal PDF generates in one click. The design, yield, and financial data share a single source of truth.
Cut Design-to-Proposal Time to Under 4 Hours
SurgePV connects site assessment, 3D design, shading simulation, and financial modeling in one workspace — so your proposal goes out the same day as the site visit.
Book a DemoNo commitment required · 20 minutes · Live project walkthrough
Step 6: Close — Objection Handling and Contract
The close is the step most solar training programs over-focus on. In practice, if the first five steps are done well, the close is mostly logistics. The objections that kill deals at this stage are almost always symptoms of earlier failures — an unclear proposal, a missed qualification issue, or a financial model the customer doesn’t trust.
The 5 Most Common Solar Sales Objections
| Objection | Root Cause | Effective Response |
|---|---|---|
| ”It’s too expensive” | Monthly cost framing failure | Show current bill vs. monthly loan payment side-by-side |
| ”I need to think about it” | No proposal review call; customer reviewing alone | Pre-schedule the review call; don’t send and wait |
| ”My neighbor got a lower quote” | Competing proposal without shading-adjusted production | Show production difference between systems; cheaper quote often means smaller system or lower-quality modules |
| ”I don’t trust the savings estimate” | Generic production numbers; no site-specific simulation | Walk through the shading simulation; show hourly irradiance data for their address |
| ”I’m worried about the roof warranty” | Information gap | Clarify that your workmanship warranty covers penetrations; roof age check should have flagged any issue at assessment |
E-Signature Timeline
Moving from verbal yes to signed contract used to take multiple days under paper-based processes. DocuSign reports that up to 80% of agreements completed through their platform are finalized in less than a day, and 44% in under 15 minutes (DocuSign, 2024). Sending the contract immediately after verbal agreement — not batched for the next morning — captures that speed. Every hour between verbal yes and signed contract is time for the customer to re-read the competitor’s proposal.
Financing and Permit Timeline After Signature
| Stage | Typical Duration |
|---|---|
| Loan application decision | 24–48 hours (automated underwriting) |
| Permit application submission | 1–5 business days (rep or office task) |
| Permit approval | 3 days–12 weeks (jurisdiction-dependent) |
| Interconnection application | 1–6 weeks (utility-dependent) |
| Total: contract-to-install-ready | 4–16 weeks |
Permit timelines are the least controllable variable in the entire process. The teams that manage this best pull their historical permit data by jurisdiction and set customer expectations at the time of signing — not when the customer calls asking why the installation hasn’t started.
Common Close Slowdown
Rep sends proposal, waits passively for customer to respond. 3 days later they send a follow-up email. By then the customer has signed with the competitor who followed up by phone within 24 hours.
Fix: Pre-schedule the proposal review call at the time of the site assessment. “I’ll have everything ready on Thursday — let’s walk through it together at 2 PM” is a one-sentence change with a measurable impact on close rate.
Step 7: Install Handoff and Post-Install
The sale is done. The installation is where the customer relationship either becomes a referral source or a complaint.
The biggest risk at handoff is information loss. A sales rep who documented the site assessment in a personal phone and built the proposal in a separate tool hands a half-complete project file to the operations team. The installer arrives without knowing about the MSP upgrade requirement flagged at assessment. An emergency service call, a cost overrun, and an unhappy customer follow.
Post-Contract Timeline
| Milestone | Owner | Typical Duration |
|---|---|---|
| Contract signed → project created in PM system | Sales + ops | Same day (automated if CRM triggers PM) |
| Permit application submitted | Ops / permit team | 1–5 days |
| Materials ordered | Procurement | 3–10 days |
| Permit approved | Local AHJ | 3 days–12 weeks |
| Interconnection agreement | Utility | 1–6 weeks |
| Install scheduled | Field ops | After permit + materials |
| Installation day | Field crew | 1–3 days for residential |
| Inspection | Local AHJ | 1–10 days after install |
| Permission to Operate (PTO) | Utility | 1–4 weeks after inspection |
The PTO Referral Ask
Permission to Operate is the highest-satisfaction moment in the entire customer journey. The system is live, the app shows real-time production, and the customer’s first bill with solar is about to arrive. This is the exact moment to ask for a referral — not a month later in a generic email.
Train your install teams to complete a 5-minute handoff conversation at PTO: confirm the monitoring app is working, explain what the customer will see on their first bill, and ask one direct question: “Is there anyone in your neighborhood or family who has talked to you about solar?”
A systematic PTO referral ask, tracked in your CRM and incentivized at $200–$500 per install referral, can drive a meaningful share of new lead volume — solar companies with active referral programs commonly see referrals contribute 15–30% of their pipeline over time.
Monitoring and Post-Install Follow-Up
Connect system monitoring at install. Schedule an automated 30-day check-in (email or call) to confirm production is meeting the proposal estimate. A system underperforming by more than 10% in the first month needs a service ticket — not a bill surprise in month 6.
Handoff Checklist
Before marking a project as “install-ready” in your CRM: permit number logged, interconnection application submitted, MSP upgrade status confirmed, materials ordered, monitoring account created and credentials sent to customer. Five checkboxes that prevent 80% of install-day surprises.
Common Handoff Slowdown
No formal trigger connects the signed contract to a project record in the operations system. Sales marks the deal won; operations finds out when the customer calls to ask about their install date.
Fix: Configure your CRM so that a contract signature automatically creates a project in your project management tool and assigns it to an operations owner. The trigger takes 15 minutes to set up and removes a persistent handoff failure.
The 100-Lead Funnel: A Realistic Benchmark
Here is what 100 leads produce under average conditions vs. an optimized process.
Average vs. Optimized Funnel
| Stage | Average | Optimized | Change |
|---|---|---|---|
| Leads received | 100 | 100 | — |
| Leads reached within 60s | 25 | 80 | +220% |
| Qualified leads | 20 | 35 | +75% |
| Site assessments completed | 12 | 28 | +133% |
| Proposals delivered | 10 | 24 | +140% |
| Proposals opened / reviewed | 4 | 20 | +400% |
| Contracts signed | 6 | 20 | +233% |
| Close rate (of all leads) | 6% | 20% | +14pp |
| CAC at ~$206 CPL | $3,433/install | $1,030/install | −70% |
At a $20,600 lead spend (100 leads × $206), the average team installs 6 systems. The optimized team installs 20. Same lead spend. Same product. The difference is three process changes: sub-60-second response, structured qualification, and same-day proposal delivery.
The Three Biggest Leak Points
Leak 1: Slow response time. The MIT/InsideSales Lead Response Management Study found that the probability of qualifying a lead drops dramatically after the first five minutes from inquiry (InsideSales / MIT, 2007). This is the highest-impact single fix in the entire funnel.
Leak 2: Skipped qualification. Spending field time on unqualified leads depresses close rate and burns rep capacity. A 5-question pre-survey before every site visit cuts wasted assessment trips by 30–40%.
Leak 3: Slow proposal delivery. A proposal that takes 3–7 days to produce goes to a customer who has already moved on or signed with a competitor. Cutting design-to-proposal time to under 4 hours using integrated solar software is the fix with the second-highest CAC impact after response time.
CRM and Tooling: What Top Performers Use
No sales process survives without tooling. The question is which tools to connect and in what order.
Solar Sales CRM Options
| CRM | Best For | Approx. Monthly Cost (5 users) |
|---|---|---|
| JobNimbus | Residential teams under 30 users | $200–$500+ (base plan + per-user fees; see jobnimbus.com/pricing) |
| Sunbase Solar CRM | Solar-native residential + D2D | $150–$300 (contact vendor for current pricing) |
| SalesRabbit | D2D canvassing + pipeline management | $195–$245 (Team/Pro plan for 5 seats per salesrabbit.com/pricing) |
| HubSpot (configured) | Teams needing marketing automation | $100–$250+ (5 seats at $20–$50/seat/mo per hubspot.com) |
| Salesforce | Enterprise EPCs with complex needs | $125–$875+ (5 seats across Starter to Enterprise per salesforce.com/pricing) |
| ServiceTitan | Large residential and C&I installers | $600–$3,000+/mo (per servicetitan.com/pricing) |
A CRM handles pipeline management and customer records. It does not handle system design, energy simulation, or proposal generation. Those functions require a separate design and proposal platform — and the quality of that platform is the second-biggest driver of deal velocity after response time.
The Design and Proposal Gap
Most solar companies run at least 3 tools: a CRM, a design tool, and a proposal tool. Data enters manually at each transition. A lead becomes a site record in the CRM. The site record is copied into a design tool. The design output is copied into a proposal template. Each handoff takes 20–60 minutes and risks introducing errors.
The fix is an integrated workspace where the site data flows from assessment to design to proposal without manual re-entry. Solar design software that connects 3D modeling, shading simulation, energy yield, and proposal generation in one platform cuts the design-to-proposal cycle from days to hours.
Recommended Stack for Growing Installer Teams
- CRM: JobNimbus or HubSpot (configured for solar stages)
- Design + proposal: SurgePV — 3D rooftop design via solar designing, physics-based shading via shadow analysis, financial modeling via the generation and financial tool, branded proposals via solar proposals
- E-signature: DocuSign or PandaDoc
- Field operations: Scoop Solar or ServiceTitan (for larger teams)
- Financing: Mosaic, GoodLeap, or Sunlight Financial API integration
The most common mistake is buying a CRM that promises to “do everything” — then discovering it does design and proposal poorly. The better approach is a best-in-class CRM for pipeline management and a best-in-class design and proposal platform that integrates with it.
Conclusion: Three Actions to Take This Week
Most solar teams know their close rate. Few know where exactly in the funnel they’re losing. The 100-lead math above shows that process optimization, not product improvement, is where the next 14 percentage points of close rate are sitting.
Three things to do this week:
-
Audit your response time. Pull the last 100 leads from your CRM and measure the time from lead entry to first contact attempt. If more than 20% of leads wait longer than 5 minutes, fix your assignment and SMS automation before anything else.
-
Time your design-to-proposal cycle. Pick the last 20 proposals and measure the days from completed site assessment to proposal sent. If the average is over 2 days, the design queue is your biggest CAC problem. Start training reps to run sales-grade preliminary designs.
-
Add the PTO referral ask to your install checklist. One direct question at the moment the system goes live costs nothing and compounds into a meaningful share of your lead volume within 6–12 months.
The data doesn’t require a bigger marketing budget or a new product. It requires a process that captures what the marketing budget already spent and doesn’t hand those leads to a faster competitor.
See the Full Solar Sales Workflow in 20 Minutes
SurgePV connects lead-to-proposal in one workspace — design, shading simulation, financial modeling, and branded proposal in under 4 hours from site assessment.
Book a DemoNo commitment required · 20 minutes · Live project walkthrough
Frequently Asked Questions
What are the steps in the solar sales process?
The solar sales process runs seven steps: lead generation, initial qualification, site and energy assessment, system design and simulation, proposal and financial modeling, close and contract, and install handoff with post-install follow-up. Each step has a distinct owner, a CRM stage, and a measurable exit condition. Skipping or merging steps is the most common cause of low close rates.
How long does the solar sales process take from lead to install?
From first contact to physical installation, the residential solar sales process typically runs 8–16 weeks. The sales cycle itself — lead to signed contract — averages 4–10 weeks. Permitting adds 3 days to 12 weeks depending on the jurisdiction, and interconnection approval from the utility can extend timelines further.
What is a typical solar sales funnel?
A typical solar sales funnel converts roughly 6% of all leads to installs. Out of 100 leads, about 40 are reachable, 20 qualify on bill and roof criteria, 12 receive a site assessment, 10 get a proposal, and 6 sign. High-performing teams push this to 15–20% conversion by improving response time, qualification rigor, and proposal speed.
How do you qualify a solar lead?
Qualify a solar lead on four criteria: monthly electricity bill (generally $80+ for residential), roof condition and orientation, ownership status, and credit or financing eligibility. A 5-question pre-survey sent before the site visit filters unqualified leads before you spend time on an in-person assessment.
What is the average cost per solar lead?
The average solar lead costs around $206 across all channels (Clean Energy Experts, 2024). Paid search and aggregator leads run $150–$400 per lead. Referrals cost $50–$150 in incentive spend. Door-to-door canvassing is roughly $20–$60 per contact but produces lower close rates than inbound channels. Customer acquisition cost is projected to average $0.84/W for residential installations in 2026 (Wood Mackenzie, 2025).
What is a good close rate for solar sales?
An average solar close rate is commonly cited at around 6% of all leads. High-performing teams achieve 15–25% of qualified leads by improving response time to under 1 minute, using digital proposals, and pre-scheduling the proposal review call at the time of site assessment.
How do solar companies handle objections about cost?
The most effective response to cost objections is an immediate monthly payment comparison: show the customer’s current electricity bill against the proposed monthly loan payment. For most US markets, a financed 6 kW system at current rates delivers Day 1 savings. Showing 15-year vs. 25-year scenarios side-by-side — with payback and IRR — converts hesitation into a concrete financing decision. See our guide on Agricultural Solar Case Study for more. Read more about Floating Solar Farms France.
How long does it take to get solar permits approved?
Solar permit approval times range from 3 days in online instant-issue jurisdictions to 12 weeks in complex jurisdictions or those requiring structural engineering sign-off. Most US residential permits process in 1–4 weeks. Interconnection agreements with the utility typically take 2–8 weeks on top of the building permit.