Quick Answer
A single DC fast charger draws 150 kW constantly during a session. Miles Added/Hour Level 1. 1.4–2.4 kW. 120V AC. The energy return is too low to justify a dedicated solar allocation, and the 8–20 hour session duration provides negligible throughput for any multi-vehicle site. Many commercial sites in older industrial areas have 208V or 240V three-phase service — not 480V.
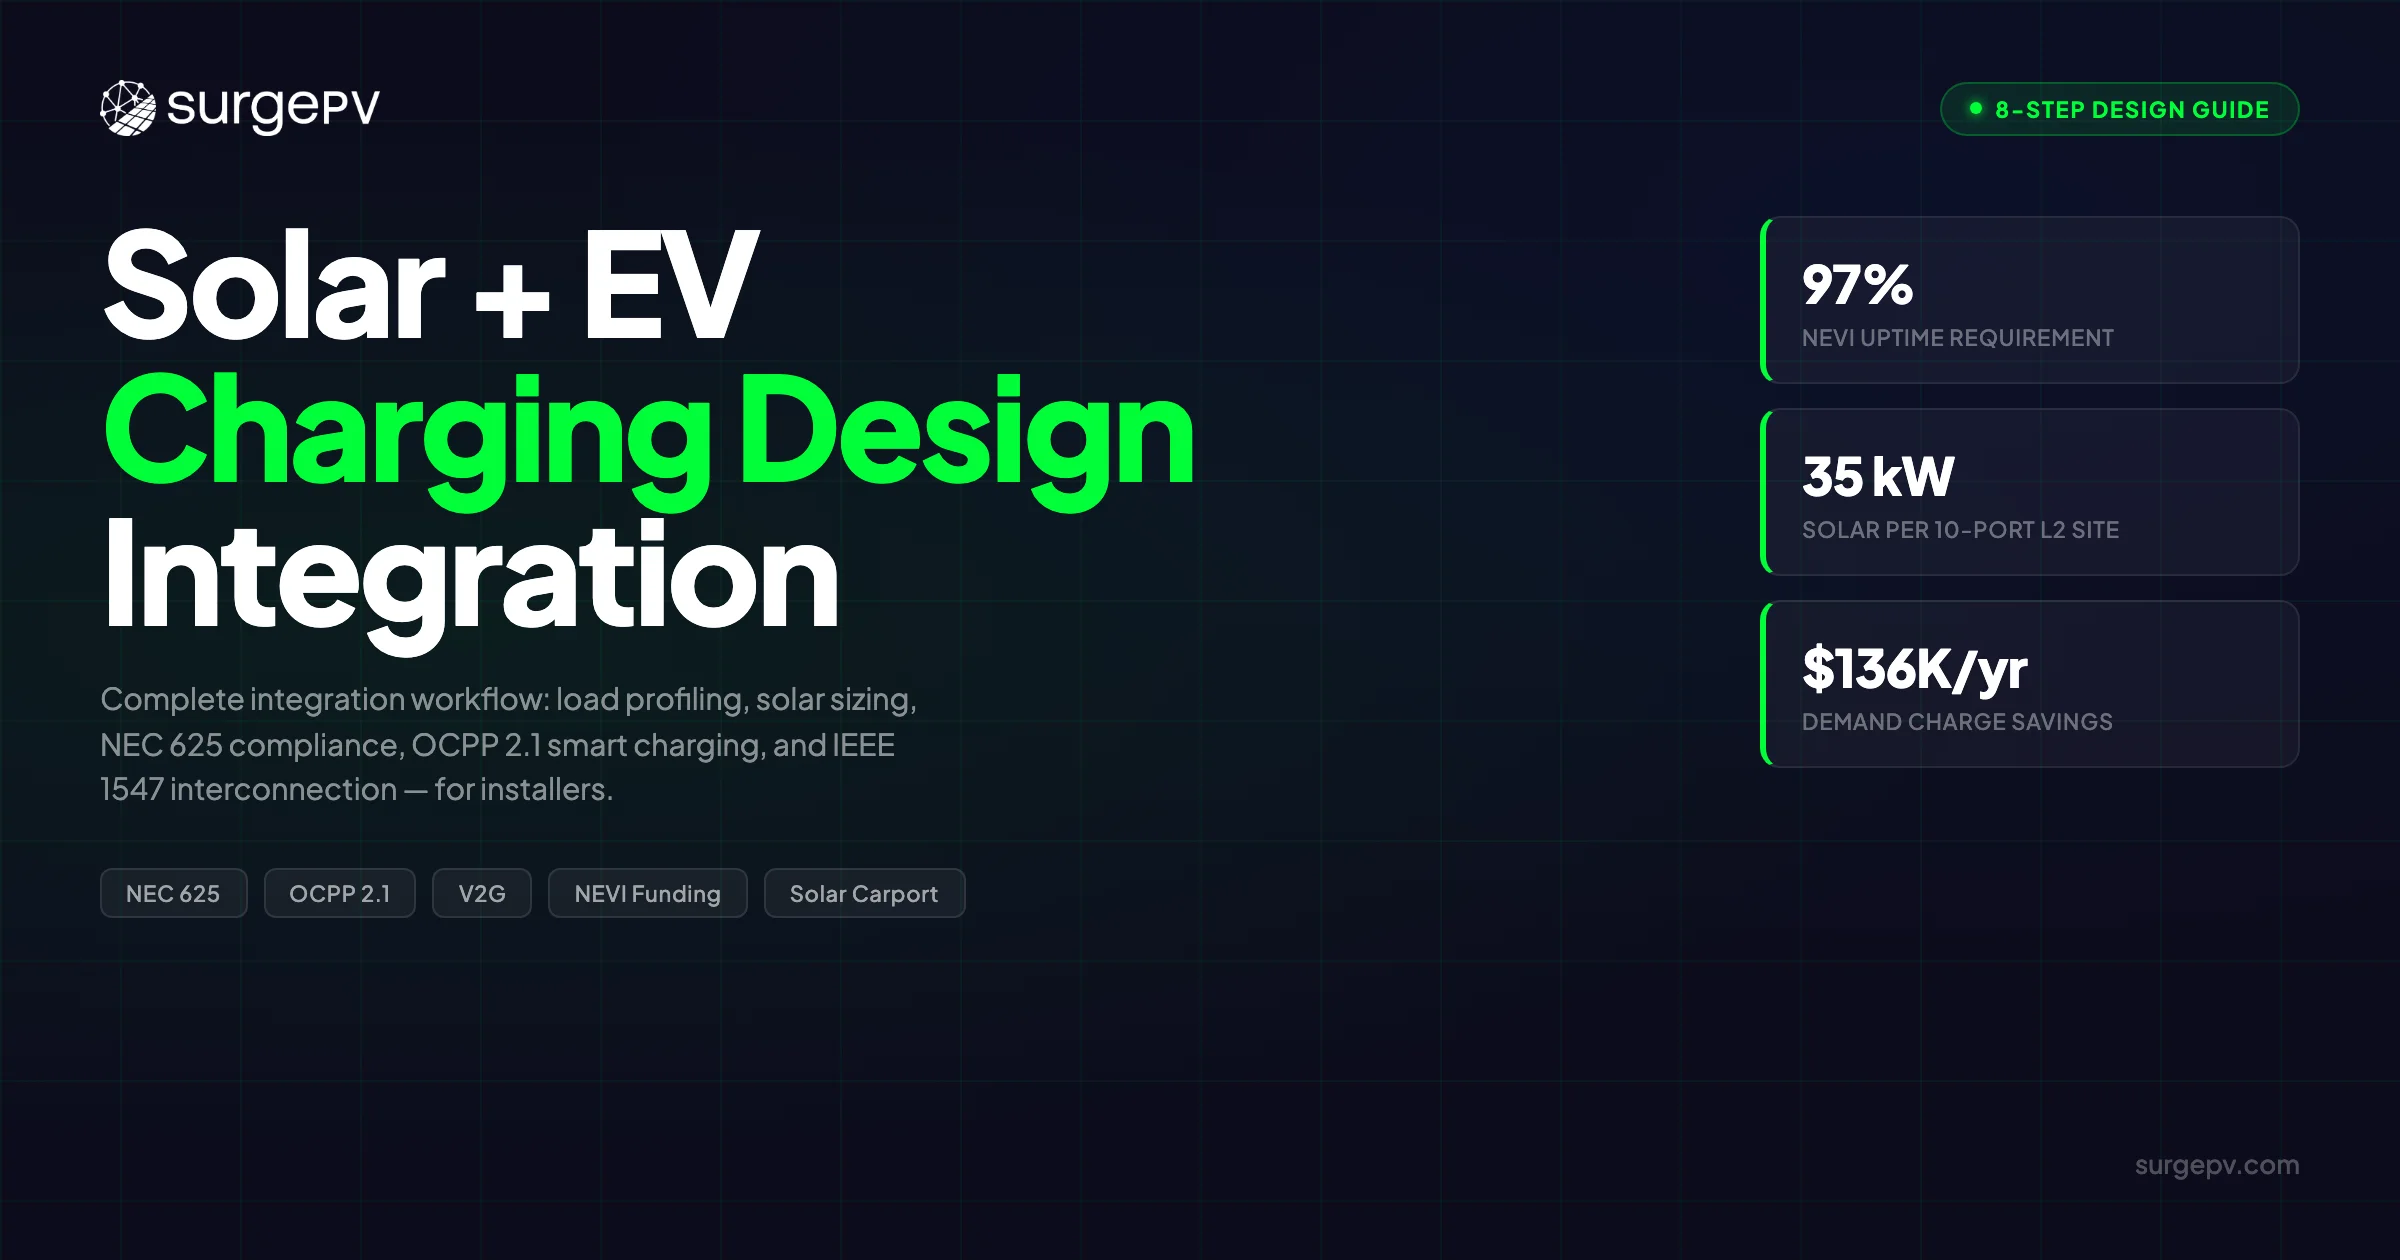
EV adoption in the US is accelerating. Grid-connected EV stock is forecast to exceed 40 million vehicles by 2030, and commercial property owners are under increasing pressure to provide charging infrastructure at the same sites where solar installations are already planned or operating. The design problem that emerges when both land on the same project scope is not trivial, and most existing guides treat it as two separate problems.
A single DC fast charger draws 150 kW constantly during a session. Miles Added/Hour Level 1. 1.4–2.4 kW.
The core engineering tension is this: EV chargers are high-demand continuous loads. A single DC fast charger draws 150 kW constantly during a session. Solar is intermittent — it follows irradiance curves, not charging schedules. Battery storage and smart controls bridge the gap, but only if the design sequence is correct. Get the EV load calculation wrong and every downstream decision — array size, battery capacity, inverter architecture — is built on a flawed foundation. See Adding Battery Storage Services for detailed guidance.
This guide covers 8 design steps in sequence: (1) site load profiling and charger selection, (2) solar array sizing for EV loads, (3) battery storage design, (4) inverter architecture selection, (5) NEC 625 circuit compliance, (6) solar carport layout, (7) OCPP smart charging and EMS integration, and (8) IEEE 1547-2018 grid interconnection. It is written for solar installers and electrical engineers quoting or designing integrated solar-EV projects at residential, commercial, and NEVI-funded highway corridor sites.
Most guides fail because they cover charger design or solar design — not the integrated workflow that connects both into a compliant, financially defensible system.
TL;DR
Size the EV load first (charger type × vehicle count × diversity factor), then size the solar array (daily kWh ÷ peak sun hours ÷ 0.80), then decide on battery storage based on whether demand charges are a factor. Architecture — DC-coupled or AC-coupled — follows load volume and retrofit context. Circuit sizing is governed by NEC Article 625 continuous-load rules. OCPP 2.1 and IEEE 1547-2018 close the loop on smart charging and grid interconnection.
After reading this guide, you’ll be able to:
- Calculate daily EV energy draw for residential and commercial fleet sites with the correct diversity factor applied
- Size a solar array specifically for EV charging loads using the standard derate formula
- Determine when battery storage transitions from optional to financially required
- Choose between DC-coupled and AC-coupled architecture based on site context and load fraction
- Size circuits per NEC Article 625 continuous-load rules and identify the ALMS exception that can eliminate a service upgrade
- Apply GCR, clearance, and bifacial optimization parameters to solar carport layouts
- Specify an OCPP 2.1-compatible EMS stack and document it for NEVI and AHJ submittals
- File a utility interconnection application that accounts for V2G export under IEEE 1547-2018
Step 1: Site Load Profiling — Charger Selection and EV Load Calculation
Charger Type Selection
The first decision is hardware: what level of charging does this site require? The answer comes from dwell time — how long the vehicle sits at the charger during a typical session — not from the vehicle’s maximum charging capability.
| Level | Power | Voltage | Circuit | Session Duration | Miles Added/Hour |
|---|---|---|---|---|---|
| Level 1 | 1.4–2.4 kW | 120V AC | Standard outlet | 8–20 hours | ~5 miles |
| Level 2 (30A) | 7.2 kW | 208/240V | 40A dedicated | 4–8 hours | 25–30 miles |
| Level 2 (48A) | 11.5 kW | 208/240V | 60A dedicated | 3–5 hours | 40–45 miles |
| Level 2 (80A) | 19.2 kW | 208/240V | 100A dedicated | 2–4 hours | 65–75 miles |
| DCFC 50 kW | 50 kW | 480V three-phase | 150A circuit | 30–45 min (80%) | ~200 mi in 30 min |
| DCFC 120 kW | 120 kW | 480V three-phase | 250A circuit | ~20 min (80%) | ~300 mi in 30 min |
| DCFC 350 kW+ | 350 kW+ | 480V three-phase | 500A+ circuit | 10–15 min (80%) | 600+ mi in 30 min |
Level 1 is almost never the right choice for a solar integration project. The energy return is too low to justify a dedicated solar allocation, and the 8–20 hour session duration provides negligible throughput for any multi-vehicle site. If a client asks about Level 1, the honest answer is that it belongs on an extension cord for emergency use — not in a system design.
DCFC requires 480V three-phase power. Confirm this constraint before any other design work. Many commercial sites in older industrial areas have 208V or 240V three-phase service — not 480V. A service upgrade to 480V three-phase can run $25,000–$100,000 before any solar or charging equipment is purchased, and it belongs in the project budget conversation on day one.
Charger selection follows dwell time: workplace parking with 8-hour dwell → Level 2 48A; highway corridor with 20–30 minute dwell → DCFC 150 kW or higher; fleet depot with overnight dwell → Level 2 80A. The solar design builds from that selection forward.
Estimating Daily EV Energy Draw
For residential projects, the baseline is 10–15 kWh/day per vehicle, derived from the US average commute distance of 37 miles at approximately 3.5 miles per kWh. To substitute a client’s actual commute: take their daily round-trip miles, divide by 3.5, and add 10% for auxiliary loads and charging losses. A client driving 50 miles per day draws roughly 50 ÷ 3.5 × 1.10 = 15.7 kWh/day. Use that number — not the national average — in the solar sizing calculation.
For commercial fleet operations, the numbers are larger. A fleet vehicle covering 120–140 miles per day draws 35–40 kWh for daily recharging. A 20-vehicle depot needs 700–800 kWh of total charging capacity each day. That figure is the EV energy demand — and it needs to sit alongside the building’s base load in the total site energy model, not replace it.
EV load stacks on top of the existing building base load — it does not offset it. Pull 12 months of utility interval data in 15-minute increments before finalizing any sizing. Many commercial sites have base load demand peaks that already approach service capacity limits. Adding 80 kW of EV charging demand on top of an existing 150 kW afternoon building peak can trigger a service upgrade — unless the solar-battery-ALMS system is designed to prevent it.
One flag that gets missed on most fleet depot projects: cold climate energy draw. Battery pre-conditioning in temperatures below -10°C adds 15–25% to the daily energy requirement per vehicle. A 40-vehicle depot in Minnesota designed for the July average will be undersized every December through February. Size for the worst-case month.
Applying the Diversity Factor for Multi-Port Sites
The diversity factor is the fraction of installed charger capacity in simultaneous use at any moment. It reflects the reality that not every charger runs at full load at the same time — vehicles arrive and depart at different intervals, and some charge faster than others because their batteries are fuller when they plug in.
Quantify the diversity factor by site type: residential 1–2 ports → 1.0 (no diversity benefit, assume simultaneous use); small commercial 4–10 ports → 0.7–0.8; large depot 20+ ports → 0.6. These are design-side estimates. Where interval data is available from a comparable operating site, use it instead.
Worked example: a 10-port Level 2 48A commercial site. Installed charger capacity: 10 × 11.5 kW = 115 kW. Apply diversity factor of 0.7: 115 kW × 0.7 = 80.5 kW simultaneous demand. That 80.5 kW is the load the solar array and battery system must be sized to serve — not 115 kW. The difference between these two numbers can change the battery specification from a 100 kWh unit to a 200 kWh unit. Get it right.
One point worth stating clearly: diversity factor applies to solar and battery sizing but does NOT apply to NEC circuit sizing. Each EVSE circuit is sized for its own maximum rated load, at 125% per NEC 625.41, regardless of what every other charger on the site is doing. The two calculations are independent.
Pro Tip
Request 15-minute interval data from the utility covering at least 12 months before finalizing diversity assumptions. Sites with shift-based fleet operations often show near-simultaneous charging peaks during changeover windows — pushing the effective diversity factor toward 1.0 at exactly the wrong time.
Step 2: Solar Array Sizing for EV Charging Loads
The Core Sizing Formula
The formula for dedicated EV solar sizing:
kW solar = Daily kWh ÷ Peak Sun Hours ÷ System Efficiency (0.80)
The 0.80 system efficiency derate is not arbitrary. It is the product of real loss factors stacked in series: inverter conversion losses (~0.97), wiring resistance losses (~0.98), soiling and dust accumulation (~0.95), temperature derating at peak summer conditions (~0.90), and module mismatch (~0.98). Multiplied together: 0.97 × 0.98 × 0.95 × 0.90 × 0.98 = 0.795. Round to 0.80 for design purposes.
Source peak sun hours (PSH) from NREL PVWatts, SolarAnywhere, or directly through solar design software. For most US markets, PSH ranges from 3.5 (Pacific Northwest) to 6.5 (Arizona desert), with 4.5–5.5 covering most of the continental US outside of the Pacific Northwest and upper Midwest. Use location-specific data — do not apply a national average to a project in Seattle.
This formula produces the solar capacity required to offset the EV load only. The building’s base load is sized in a separate calculation using the same methodology, then the two array sizes are summed for the total system specification. Keep them separate in the design documentation — good solar software will let you model each load independently before combining them in the proposal output.
Residential Worked Example
Inputs: a single-vehicle household with a 37-mile daily commute drawing 12 kWh/day, sited in a market with 5.0 PSH, and a 0.80 system efficiency. The calculation: 12 ÷ 5.0 ÷ 0.80 = 3.0 kW of solar capacity dedicated to EV charging.
A useful sanity check: industry rule of thumb for residential EV solar allocation is 5–10 kW per Level 2 port for high-usage households, and 2–4 kW for standard commuter usage. The 3.0 kW result lands squarely in the standard commuter range — consistent with a single vehicle on a typical commute pattern. If the client’s annual mileage is higher, scale linearly. Also see: Us Residential Solar Market Trends 2026. For United States-specific compliance details, see United States arizona/phoenix.
Key Takeaway
A 3 kW addition covers average residential EV charging in most US markets. It’s a straightforward upsell for installers already quoting a rooftop system — present it as a line item in the solar proposal software output.
Commercial Worked Example (10-Port Site)
Inputs: a 10-port Level 2 commercial site averaging 14 kWh of energy dispensed per port per day (total: 140 kWh/day), sited at 5.0 PSH, with 0.80 system efficiency. The calculation: 140 ÷ 5.0 ÷ 0.80 = 35 kW of solar array for EV load only.
Per-port check: 35 kW ÷ 10 ports = 3.5 kW/port. This is appropriate for a daytime-dwell workplace where vehicles park from 8 AM to 5 PM and the parking lot empties at the end of the workday. The solar production window (roughly 7 AM to 6 PM) overlaps well with the charging window — minimal battery storage is required if the grid handles overnight spillover via net metering.
When over-sizing the array makes sense: NEVI sites require 97% uptime, which makes a larger array and storage buffer almost mandatory. Model the full solar + EV revenue offset and payback using a generation and financial tool — input the actual utility tariff, the projected kWh dispensed annually, and the NEVI reimbursement offset to generate the correct NPV and IRR. Presenting a flat payback period without these variables will understate the project’s financial return.
DC/AC Ratio Considerations for EV-Heavy Sites
The DC/AC ratio (also called the inverter load ratio) is the relationship between the rated DC power of the array and the rated AC power of the inverter. Standard residential designs run 1.15–1.25. EV-heavy commercial sites can push higher, depending on architecture.
| System Type | DC/AC Ratio | Rationale |
|---|---|---|
| Residential (no storage) | 1.15–1.25 | Standard residential design |
| Commercial (no storage) | 1.10–1.25 | Limits clipping losses |
| Commercial + storage, DC-coupled | 1.30–1.50 | Clipping absorbed by battery |
| DCFC + storage | 1.20–1.40 | Constrained by inverter thermal rating |
At a DC-coupled site with storage, solar clipping during peak midday hours — power that would otherwise be wasted — charges the battery instead. The battery then supplies the evening EV charging peak when solar is falling. This is the strongest technical argument for a higher DC/AC ratio at solar-EV sites: clipping losses become stored energy rather than wasted generation. Ratios above 1.50 with storage are viable in some thermal environments but require manufacturer review of the hybrid inverter’s thermal management specifications before specifying.
Step 3: Battery Storage Design — When You Need It and How to Size It
When Battery Storage Is Required vs. Optional
Battery storage is optional at residential Level 2 sites where the building load is predominantly daytime-heavy, net metering is available under a favorable tariff, and no demand charges apply to the residential account. In this case, the grid handles overnight EV charging at a net-metering credit, and the economics are clean.
Storage is required under four conditions: DCFC sites with high peak draw that exceeds the available grid service; C&I accounts with meaningful demand charges billed on 15-minute peak intervals; NEVI-funded sites with a 97% uptime mandate; and fleet depots where the bulk of charging happens after sunset when solar output is zero. Any one of these conditions alone justifies the storage investment. NEVI uptime requirements effectively make it mandatory.
Apply this trigger rule: if the peak EV demand (post-diversity-factor) exceeds 30% of the total utility service capacity at the point of interconnection, model battery storage before finalizing the rest of the design. Attempting to service 80 kW of EV charging on a 200 kW service without storage means the building base load and EV load will routinely push the site above the demand charge threshold — every month, for the life of the project.
Demand Charge Math — The Core Business Case
Demand charges represent 30–70% of C&I utility bills, according to NREL analysis of commercial rate structures across the US. They are billed on the highest 15-minute kW peak recorded in a billing period. One EV charger ramp-up event during a January cold snap — when building HVAC and heating systems are simultaneously at peak — can set the demand charge baseline for the entire month.
Battery dispatch during high-demand events shaves that peak. A properly sized and configured battery system reduces peak demand charges by 40–70% in most C&I applications. The battery charges from solar (or off-peak grid power) during low-demand windows, then discharges during the demand charge window to keep the site’s 15-minute peak below a customer-defined threshold. That threshold becomes the ALMS set point from NEC 625.42 (addressed in Step 5).
Worked example from a real installation: one workplace solar-plus-storage project documented by Paired Power (2024) reduced annual utility spend from $339,200 to $203,100 — a $136,100/year improvement. At an installed battery cost of $400–$800/kWh, that savings figure, amortized against the battery capital cost, produces a battery-specific payback of 3–6 years before counting any solar energy offset. That is how the storage ROI conversation should be framed with C&I clients.
Pro Tip
Pull the client’s 12-month utility bills and identify the single highest demand month. That peak month — not the annual average — determines the battery discharge capacity needed to fully shave demand charges.
Sizing the Battery Bank
The primary sizing variable differs by site type: for residential and commercial Level 2 sites, energy capacity (kWh) drives the specification. For DCFC sites, peak discharge power (kW) is the binding constraint — the battery must be able to supply peak DCFC load faster than the grid service can deliver it.
| Site Type | Battery Required? | Size Driver | Cost Range |
|---|---|---|---|
| Residential L2 (net metering available) | Optional | Energy (kWh) | $400–$800/kWh |
| Commercial L2 with demand charges | Strongly justified | Peak discharge (kW) | $400–$800/kWh |
| DCFC with grid constraint | Required | Peak discharge (kW) | $400–$800/kWh |
| NEVI-funded station | Required | Both kW + kWh | $400–$800/kWh |
An NREL case study on battery-buffered DCFC installations shows the scale clearly: 4×150 kW DCFC ports operating on a 125 kW grid connection. The battery must supply 475 kW peak — the gap between the 600 kW total charger demand and the 125 kW grid connection — and sustain that through 1,632 kWh of daily dispensed energy. No amount of smart charging optimization changes the physics: if the grid service is 125 kW and the chargers demand 600 kW, the battery supplies the difference.
For overnight fleet depots, energy sizing drives the specification: battery capacity (kWh) = post-sunset EV demand (kW) × evening charging window (hours). A depot with 30 kW of charging load from 6 PM to midnight needs 30 × 6 = 180 kWh of usable battery capacity, sized to the depth of discharge (DoD) specification of the selected battery chemistry — typically 80–90% usable for lithium iron phosphate (LFP).
Certification requirements for commercial battery installations: UL 9540 (energy storage system) and UL 9540A (fire hazard assessment) are required in most jurisdictions for any commercial BESS. Above 20 kWh, a fire marshal or AHJ review is standard. Build 4–6 weeks for fire marshal review into the project schedule — it is on the critical path for any C&I battery installation.
Step 4: Inverter Architecture — DC-Coupled vs. AC-Coupled Decision Matrix
How Each Architecture Routes Power
DC-coupled architecture uses a hybrid inverter that manages the PV array, battery bank, and AC output from a single unit. Solar panels feed the DC bus directly. The hybrid inverter controls battery charging and discharging on the DC side, then inverts to AC for the building loads and EV chargers. Because power only converts once — DC to AC — the round-trip efficiency is 96–99%.
AC-coupled architecture keeps an existing grid-tie inverter in place. A separate battery inverter is added to the AC bus. The battery charges from AC power (from the grid or the existing solar inverter) and discharges to AC. Power converts twice: DC (solar) → AC (grid-tie inverter) → DC (battery charging) → AC (battery discharge). That double conversion produces a round-trip efficiency of 85–92%.
The 7–14 percentage point efficiency gap compounds at commercial scale. A 100 kWh battery cycling once per day at an AC-coupled site loses roughly 8–15 kWh more per cycle than the same battery in a DC-coupled setup. Over a 25-year system life, that difference is meaningful lost generation — and it argues clearly for DC-coupled architecture wherever the project context allows it.
The Decision Matrix
| Criterion | DC-Coupled | AC-Coupled |
|---|---|---|
| Round-trip efficiency | 96–99% | 85–92% |
| Best fit | New builds, high EV load fraction | Retrofits, existing solar in place |
| DCFC compatibility | Yes, with appropriately rated hybrid inverter | Yes — DCFC is an AC load |
| Battery integration | Native on DC bus | Separate battery inverter required |
| Retrofit complexity | Must replace existing inverter | Adds alongside existing system |
| Installer skill requirement | Higher (DC bus commissioning) | Lower (AC-side addition) |
DC-coupled is the right call for: new builds where EV charging will represent more than 25% of total site load; DCFC installations where peak power demand exceeds 100 kW; sites with a high DC/AC ratio design where significant solar clipping would otherwise occur and battery absorption makes the economics work. In all three cases, the efficiency advantage and battery integration simplicity of DC-coupled architecture pays for the additional commissioning complexity.
AC-coupled is the right call for: retrofits where the existing solar system is already commissioned and the client does not want to restart the interconnection process (a valid concern — restarting the interconnection clock can add 2–4 months); projects where the EV load fraction is below 25% of total site load; budget-constrained projects where replacing a functioning inverter is not economically justified. The efficiency penalty is real, but so is the cost of a full inverter replacement.
Hybrid Inverter Selection Criteria for EV Sites
Check the inverter’s continuous AC output power specification against peak EV charger demand — not just the rated PV input. Many hybrid inverters are sized for their PV input capacity, which may be larger than their AC output capacity. A hybrid inverter with a 100 kW PV input and a 75 kW AC output cannot serve 80 kW of EV charger load continuously.
DCFC power factor is a second specification to verify. Some hybrid inverters produce non-ideal waveforms under high-load switching conditions. Confirm with the DCFC equipment manufacturer that the inverter’s output waveform is compatible with the charger’s rectifier design — a mismatch here shows up as harmonic distortion and potential DCFC fault trips under load.
SunSpec Modbus interface is required for EMS communication (addressed in Step 7). If the hybrid inverter does not expose standard SunSpec registers on its Modbus TCP port, the EMS cannot read real-time PV production and battery state of charge. Integration with a proprietary API is possible but adds custom middleware development cost — typically $5,000–$15,000 for a one-off integration. UL 1741 SA certification must appear on the inverter data sheet for NEVI grant eligibility and most utility interconnection agreements.
Key Takeaway
For any new C&I site where EV charging will represent more than 25% of total load, DC-coupled architecture is almost always the right call. The 7–14 percentage point efficiency advantage compounds at commercial scale — and it becomes the foundation that OCPP smart charging and V2G export build on.
Step 5: Circuit Design and NEC 625 Compliance
The Continuous Load Rule — NEC Article 625
NEC Article 100 defines a continuous load as one expected to draw maximum current for 3 or more consecutive hours. EV charging is explicitly classified as continuous under NEC 625.2. The consequence: conductors and overcurrent protection devices (OCPD) must be sized at 125% of the charger’s maximum rated current per NEC 625.41.
| Charger | Rated Amps | ×1.25 | Minimum Circuit | Conductor (Cu) | OCPD |
|---|---|---|---|---|---|
| L2 30A | 30A | 37.5A | 40A | #8 AWG | 40A |
| L2 48A | 48A | 60A | 60A | #6 AWG | 60A |
| L2 80A | 80A | 100A | 100A | #1 AWG | 100A |
| DCFC 150A | 150A | 187.5A | 200A | 4/0 AWG | 200A |
The most common AHJ rejection on first-time EV charger permit submissions: the installer sized the circuit to the charger’s rated current instead of 125% of rated current. A 48A Level 2 charger needs a 60A circuit and #6 AWG copper — not a 50A circuit with #8 AWG. It is a one-line fix in the design drawings. Caught at inspection, it is a two-week delay waiting for a correction and re-inspection window.
One additional note for DCFC sites: the 150A rated current example in the table refers to the service connection current at 480V three-phase, not the DC output current to the vehicle. The DC output at 150 kW and 480V three-phase is roughly 180A DC per pole. Verify with the DCFC manufacturer which current figure governs the circuit sizing for their specific unit — some manufacturers rate the service connection separately from the DC output current.
ALMS Exception (NEC 625.42) — More Capacity Without a Bigger Service
NEC 625.42 defines an Automatic Load Management System (ALMS) as software or hardware that monitors total simultaneous charger output and limits it dynamically to prevent the aggregate from exceeding a defined threshold. The ALMS exception allows circuit conductors to be sized to the ALMS-controlled maximum output rather than to 125% of the full installed charger capacity.
In practice: a 10-port site with a 60 kW ALMS set point can size the service entrance for 60 kW instead of the 125% × 115 kW = 143.75 kW that the unmanaged calculation would require. That difference often means the difference between a 200A service and a 400A service — a $15,000–$50,000 gap in installed cost depending on the utility’s service territory and the distance from the nearest transformer.
ALMS documentation must be submitted to the AHJ as part of the permit package. The OCPP-based EMS from Step 7 typically is the ALMS — it monitors aggregate charger output in real time and throttles individual chargers to maintain the site below the defined demand cap. Document this explicitly in the permit drawings, including the EMS vendor, the set point, and how the system communicates with each EVSE. If the AHJ has not seen an OCPP-based ALMS submission before, plan for a pre-submission meeting.
Grounding, Bonding, and Panel Sizing
All EV chargers must be grounded and bonded per NEC Article 250. DCFC installations introduce DC-side bonding requirements that residential-focused electricians regularly miss on their first commercial EV project. The DC output conductors between the charger’s rectifier and the vehicle connector are current-carrying conductors that require bonding at both the charger enclosure and the service entrance ground bus. Check the specific charger manufacturer’s installation manual — bonding requirements vary between CHAdeMO, CCS, and NACS connector systems.
Panel sizing for EV additions: take the total EV load (post-diversity factor, post-ALMS adjustment) and add it to the building base load, then add 20% headroom for future expansion. Clients who add 2 Level 2 chargers today routinely want 6 in three years as their fleet electrifies further. Building that capacity into the panel and service entrance from the start costs significantly less than returning to add it after the original system is commissioned and the trenching is backfilled.
V2G and Article 705 — When Exporting Triggers New Rules
V2G and V2H in export mode make the EVSE a power production source under NEC definitions. NEC Article 705 (Interconnected Power Production Equipment) applies — the same article governing grid-tied solar and battery systems. Article 705 requirements include: system labeling at the disconnecting means, a dedicated disconnecting means accessible to utility personnel, anti-islanding protection certified for the combined export capacity, and an executed utility interconnection agreement.
A Wallbox Quasar 2 permitted for V2G export requires the same AHJ and utility review process as an additional grid-tied inverter. This means single-line drawing revisions, a new or amended interconnection application, and utility feasibility study time. It is not a permit modification — it is a new system addition in the eyes of most utilities and AHJs. Plan accordingly.
V2G-compatible vehicles in 2026: Ford F-150 Lightning (9.6 kW export), Hyundai Ioniq 5 and 6 (3.6 kW), Kia EV6 and EV9, Nissan Leaf with CHAdeMO, Volkswagen ID.4 and ID.Buzz (select markets), and Tesla Cybertruck. The vehicle list is expanding faster than the EVSE certification and utility program infrastructure — confirm that both the charger and an active utility V2G program exist before designing V2G export into a project.
Key Takeaway
V2G is not plug-and-play. Every export-capable installation needs an Article 705 review, a utility interconnection amendment, and updated single-line drawings submitted to the AHJ. Budget 4–8 weeks for approval on first-time submissions in most jurisdictions.
Step 6: Solar Carport Design — Layout, GCR, and Bifacial Optimization
When a Carport Makes More Sense Than Rooftop
Three situations make the carport the better answer. First: the commercial roof is at or near structural capacity. Adding solar panel dead load to a roof that already carries HVAC equipment, membrane systems, and code-required maintenance access can require costly structural reinforcement — sometimes more expensive than the carport structure itself.
Second: the roof is leased, under a PPA, or subject to a landlord agreement that prohibits modifications. In this case, the carport is the only available surface. Third: EV chargers are in a surface lot where trenching conduit from a remote rooftop system adds $1,500–$2,500 per stall in conduit and labor. Integrating EV wiring into the carport structure costs $750–$1,500 per stall instead — a direct comparison that often closes the carport decision without further analysis. Read more about Agricultural Solar Case Study. For the latest details on France, see Floating Solar Farms France.
Cost premium is a real consideration: solar carports run 30–50% more per watt than equivalent rooftop systems, at $3.00–$4.00/Wp installed for commercial-scale work. LCOE over 25 years comes in at $0.045–$0.065/kWh. Typical payback on commercial carport installations is 5–8 years, consistent with ground-mount solar in the same markets. The wiring integration benefit offsets a portion of the carport premium directly.
Layout Parameters — GCR, Clearance, and Tilt
Standard parking stall dimensions are 2.6 m wide × 5.5 m deep. These constrain row pitch and, as a result, the maximum ground coverage ratio (GCR) before inter-row shading becomes a production liability. GCR is the ratio of module area to total ground area. A high GCR installs more modules in a given footprint but creates more inter-row shading during morning and afternoon hours.
For fixed-tilt carports, the recommended GCR is 0.35–0.45. Inter-row shading on a flat parking lot compounds more aggressively than on a slope with terrain relief. The GCR ceiling for carport installations is lower than for utility-scale ground-mount at the same latitude — do not apply utility-scale GCR assumptions to a carport layout.
Minimum overhead clearance: 2.2 m for standard passenger vehicles; 2.4 m for sites serving delivery vans, contractor pickups with overhead racks, or SUVs with roof cargo carriers. Confirm with the facility manager what the heaviest and tallest vehicle expected to use the lot is — then add that to the permit drawings as the design basis.
Tilt angle: 10–15° is the practical optimum for most US commercial carport applications. This range balances annual energy yield (which peaks at latitude tilt but produces a minor gain over 10–15°), self-cleaning performance under rain, snow shedding in northern climates, and wind load management. Going above 15° increases the wind uplift moment at the canopy edge and requires heavier structural steel — the cost increase typically outweighs the marginal energy gain.
Use solar shadow analysis software to model inter-row shading at 9 AM and 3 PM on December 21. That date and those times represent the lowest sun angles of the year — the design-critical scenario for carport shading analysis. A layout that passes the December 21 morning check will not produce significant inter-row shading losses in any other month.
Pro Tip
Before finalizing the canopy tilt, run a wind uplift check at the proposed angle. Most carport structure suppliers require a stamped structural engineering drawing — factor 4–6 weeks for that deliverable into your project schedule.
Bifacial Rear Gain by Surface Type
Bifacial modules capture irradiance on both front and rear faces. In a carport, the rear faces down toward the parking surface — and the reflectivity of that surface (its albedo coefficient) determines how much rear-side generation the module collects. For more on this topic, see Bifacial Solar Panel Design Guide.
| Surface | Albedo Coefficient | Rear Gain | Net Production Increase |
|---|---|---|---|
| Dark asphalt | 0.05–0.10 | 3–5% | Marginal |
| Light/aged concrete | 0.20–0.35 | 11–23% | Significant |
| White reflective coating | 0.60–0.80 | 25–35% | High |
| Snow (northern climates) | Up to 0.80 | Seasonal boost | High in winter |
Dark asphalt — the default surface in most commercial parking lots — produces only 3–5% rear-side gain from bifacial modules. Light concrete more than doubles that figure. If the client is resurfacing the lot as part of a facility upgrade, specifying a light concrete or reflective coating adds direct yield with minimal incremental cost. In northern climates, snow cover on the parking surface can temporarily boost rear gain to levels approaching a white reflective coating — a meaningful winter production benefit for sites where solar output would otherwise be lowest.
Carport height also works in bifacial’s favor: modules mounted at 2.2–2.4 m clearance see more diffuse sky irradiance on the rear face than ground-mounted bifacial panels sitting 0.5–1.0 m above a ground surface. However, bifacial glass-glass modules weigh 15–20% more than monofacial modules. Confirm that the carport structural design accounts for the additional dead load before specifying bifacial — a structural calculation revision mid-project adds cost and schedule delay.
Structural and AHJ Considerations
A solar carport requires a separate structural engineering stamp in most US jurisdictions. This is not included in a standard solar permit package, and it is not interchangeable with a rooftop loading calculation. The structural engineer must address snow load (for the site’s ground snow load zone per ASCE 7), wind speed zone, soil bearing capacity for the canopy column footings, and frost depth for foundation design. Build structural engineering fees ($5,000–$15,000 for a typical commercial carport) and lead time (4–6 weeks) into every carport project budget.
Fire setback requirements for carports differ from rooftop solar. Some AHJs require a minimum 10-foot clearance between the carport edge and any adjacent building wall, based on the carport’s classification as an accessory structure. This setback directly affects how close to the building the carport can be sited — which affects conduit run length to the electrical room and whether the EVSE wiring integration savings fully materialize. Confirm local fire code requirements before finalizing the carport footprint on the site plan.
Step 7: OCPP Smart Charging and EMS Integration
Why OCPP 2.1 Matters for Solar Integration
OCPP 1.6J established the baseline for charger-to-network communication — session start, stop, and basic metering. OCPP 2.0.1 added improved security and smart charging profiles. OCPP 2.1, released in 2025, adds native distributed energy resource (DER) control and V2G capability within the protocol layer itself. The EMS can now instruct chargers on charging rate, V2G dispatch mode, and reactive power contribution without custom middleware.
Early deployments of OCPP 2.1 with AI-driven dispatch logic show 18% reduction in site peak demand and 12% increase in on-site solar self-consumption compared to unmanaged charging at the same sites. These are not theoretical numbers — they come from the EMS responding to real-time solar output and battery state of charge in 15-second control cycles instead of hourly batch schedules.
For NEVI sites: OCPP 2.1 compliance is expected to appear as a requirement in FY2026 solicitations based on current FHWA guidance trends. Specify it now. Retrofitting OCPP compliance after charger procurement means either a firmware upgrade (if the hardware supports it) or charger replacement — neither is a trivial cost at 150 kW DCFC equipment prices.
The Full Protocol Stack
The solar-EV integration protocol stack spans three communication layers. Each uses a different protocol optimized for its specific function.
| Layer | Protocol | Function |
|---|---|---|
| Charger ↔ network | OCPP 1.6J / 2.0.1 / 2.1 | Charge session control, smart charging profiles |
| Inverter ↔ EMS | Modbus TCP / SunSpec | Real-time PV production, battery state of charge |
| EMS ↔ BMS / cloud | MQTT | Building load, TOU tariff signals, demand response events |
The protocol translation layer is where most integrations encounter problems. OCPP speaks to chargers; SunSpec Modbus speaks to inverters; MQTT connects the EMS to the building management system and cloud dashboard. An energy management gateway handles translation between all three protocols and coordinates timing. Missing or incomplete SunSpec register support on the inverter is the most common integration failure point — the EMS receives no real-time PV data and falls back to grid power instead of solar priority dispatch.
Confirm inverter SunSpec support before specifying — not after delivery. Request the SunSpec register map from the inverter manufacturer and verify that production power (SunSpec Model 103), battery state of charge (SunSpec Model 802), and AC metering (SunSpec Model 203) are all supported and actively polled. If the inverter uses a proprietary Modbus mapping, integration cost increases and the timeline extends.
Solar-EMS Integration Logic
The EMS reads four inputs in real time: PV production power (from the inverter via SunSpec Modbus), battery state of charge (from the BMS via SunSpec or MQTT), building load (from a revenue-grade CT meter on the service entrance), and grid price signals (from a TOU tariff feed or utility demand response API). These four inputs drive the dispatch decisions.
Based on those inputs, the EMS runs three primary operating modes: Solar Priority — charger power is set to match PV surplus above building load, with grid power supplementing when solar output falls short of charger demand; Demand Cap — charger output is throttled to keep total site demand below the customer-set threshold, functioning as the ALMS required under NEC 625.42; and V2G Dispatch — on a utility demand response signal or TOU price trigger, the charger switches to export mode, delivering stored vehicle battery energy back through the EVSE to the grid.
Before specifying an EMS vendor, confirm that all three modes are exposed in the vendor’s OCPP smart charging profile implementation. Not all platforms implement the demand cap function with the required granularity to serve as an NEC-compliant ALMS. And not all support V2G dispatch via OCPP 2.1 yet — some require proprietary API calls that bypass the standard protocol stack entirely. Both limitations become expensive to discover after procurement.
Pro Tip
Specify EMS commissioning as a separate line item in the project scope — not bundled into inverter commissioning. OCPP integration, protocol stack setup, and demand-cap parameter tuning take a half day minimum on a first deployment at a new site.
Step 8: Grid Interconnection — IEEE 1547-2018 and the Utility Application
IEEE 1547-2018 Requirements for Solar-EV Sites
IEEE 1547-2018 governs interconnection of all distributed energy resources — solar PV, battery storage, and bidirectional chargers capable of exporting power to the grid. It sets requirements for voltage ride-through, frequency ride-through, anti-islanding protection, and reactive power capability for inverter-based resources.
The standard uses three categories. Category A systems (≤200 kW total inverter rating) cover most residential and small commercial solar. Category B and C systems — above 200 kW, or designated by the utility based on grid sensitivity — face stricter voltage and frequency response settings, with utility coordination required to set the specific parameters at commissioning. A 4-port NEVI DCFC station with 150 kW per port (600 kW total) falls into Category B by default.
Inverter certification: UL 1741 SA is the US testing standard that implements IEEE 1547-2018. It must appear on the inverter data sheet for NEVI grant eligibility, most utility interconnection agreements, and many AHJ permit requirements. If the inverter data sheet shows only UL 1741 (without the SA suffix), it certifies an older IEEE 1547-2003 implementation — not the 2018 standard. This distinction will surface during utility interconnection review and can require an inverter replacement.
The Utility Application Process
The standard interconnection sequence: pre-application meeting (optional but strongly recommended for C&I projects) → submit application with single-line drawing, site plan, and equipment specifications → utility feasibility study → executed interconnection agreement → Permission to Operate (PTO). Each utility has its own queue and timeline.
Timeline benchmarks: residential PTO in most US markets runs 2–6 weeks. C&I projects with battery storage: 3–6 months. C&I projects with V2G export capability: 4–8 months, sometimes longer in congested utility service territories where the utility’s grid model requires updated load flow analysis for every new export source. These are calendar timelines, not engineering timelines — the design work may be complete in week 2, but the PTO arrives in month 5.
One expensive mistake that recurs on solar-EV projects: adding battery storage or bidirectional charging capability after the original interconnection agreement was executed. Utilities treat this as a new application — not an amendment in most cases. The new application restarts the queue position and the clock. If storage or V2G is a likely future addition, include it in the original application even if it is not being installed immediately. The utility’s feasibility study considers the full planned capacity regardless.
Anti-Islanding and Protection Settings
Anti-islanding protection is mandatory under both IEEE 1547-2018 and NEC Article 705 for any system capable of exporting power to the grid. For a combined solar-battery-V2G installation, confirm that the hybrid inverter’s anti-islanding certification covers the full combined export capacity — not only the inverter’s standalone PV output rating. Some inverters are UL 1741 SA certified only for their rated PV input level. If the battery or V2G system can export additional power beyond the rated PV input, the anti-islanding certification may not cover that additional export range.
DCFC sites with on-site solar generation may trigger a utility requirement for a dedicated utility-grade protection relay: a 27/59/81 overcurrent/overvoltage/underfrequency relay on the service entrance. This relay functions independently of the inverter’s internal protection and provides a second layer of anti-islanding that satisfies some utilities’ interconnection standards for larger DER systems. Confirm whether the local utility requires it during the pre-application meeting — it is a $2,000–$5,000 line item if required, and a $0 line item if confirmed unnecessary before procurement.
Key Takeaway
Start the interconnection application on day one of the project. The utility feasibility study is the longest-lead item on any C&I solar-EV project. A 3-month delay at interconnection pushes the NEVI funding disbursement schedule and can affect project cash flow significantly.
V2G and Bidirectional Charging: Advanced Integration
V2L, V2H, and V2G — What Each Mode Requires
V2L (Vehicle to Load) uses the vehicle’s onboard inverter to power AC loads directly through a dedicated output port — typically at 10A or less. No special EVSE is required. No grid connection is involved. No NEC Article 705 review is triggered because the power never reaches the utility grid. V2L is useful for running power tools on a job site, powering a job trailer during construction, or providing emergency loads during a short grid outage.
V2H (Vehicle to Home) routes vehicle battery power through the home’s electrical panel to supply household loads. It requires a bidirectional EVSE certified for home integration and a transfer switch (automatic or manual) to isolate the home from the grid during vehicle discharge. If the transfer switch fully islands the home — with no path for current to reach the utility grid — NEC Article 705 may not apply. If any export path to the grid exists, it does.
V2G (Vehicle to Grid) exports vehicle battery power to the utility grid. Requirements stack: a bidirectional EVSE listed for grid export, an amended utility interconnection agreement explicitly authorizing export from that EVSE, OCPP 2.1 for utility dispatch, and IEEE 1547-2018 Category B compliance if combined export from all DERs at the site exceeds 200 kW. V2G is operationally the most complex mode and the one with the largest revenue potential.
Compatible Vehicles and Bidirectional Charger Specs (2026)
V2G-Compatible Vehicles (2026):
| Vehicle | Discharge Power | Mode | Connector |
|---|---|---|---|
| Ford F-150 Lightning | 9.6 kW | V2H / V2G | CCS + Ford Charge Station Pro |
| Hyundai Ioniq 5 & 6 | 3.6 kW | V2H / V2L | CCS |
| Kia EV6 & EV9 | — | V2H / V2L | CCS |
| Nissan Leaf (2022+) | — | V2G approved | CHAdeMO |
| Volkswagen ID.4 & ID.Buzz | — | V2H (select markets) | CCS |
| Tesla Cybertruck | — | V2H | Tesla connector |
Bidirectional Charger Specs:
| Model | Charging Power | Discharging Power | Price |
|---|---|---|---|
| Wallbox Quasar 2 | 11.5 kW | 12.48 kW | $6,440 |
| Ford Charge Station Pro | 19.2 kW | 9.6 kW | $12,000–$15,000 |
| GM Energy PowerShift | 19.2 kW | — | $7,299 |
| Sigenergy SigenStor | 12.5–25 kW | — | $4,000–$7,000 |
V2G Revenue Potential
Revenue from V2G participation ranges widely by market and program type. Demand response event participation generates $120–$400/year for a typical residential vehicle enrolled in a utility DR program. Frequency regulation services — where the vehicle battery charges and discharges rapidly to stabilize grid frequency — generate $1,500–$3,000/year in markets with active ancillary services programs. Peak capacity programs in high-value markets such as California and New England reach up to $9,000/year for a vehicle consistently available during peak grid stress events. For UK-specific information, see Battery Solar System Design UK. For United Kingdom-specific compliance details, see United Kingdom comparisons/mcs-vs-non-mcs.
The first US residential V2G power plant launched in Maryland in 2025: Sunrun, Baltimore Gas & Electric, and Ford F-150 Lightning owners dispatching vehicles to the grid during the evening peak demand window. It confirmed the model works at scale. It also confirmed that utility enrollment is the binding constraint — not vehicle availability, not charger hardware, not OCPP protocol readiness. Utilities control program enrollment, and enrollment windows open and close on the utility’s schedule.
Model V2G revenue as a line item in solar design software proposal output — but only after confirming an active demand response or grid services program that the client can enroll in. Overcommitting on V2G revenue projections when no program exists for the client’s utility is a credibility risk that surfaces at the 12-month project review. Present V2G as confirmed upside when a program exists, and as future potential when it does not.
Key Takeaway
V2G revenue projections range widely by market. Only include them in proposals after confirming an active demand response or grid services program the client can enroll in. Present V2G as upside potential, not guaranteed return.
NEVI Funding: What Installers Need to Know
NEVI FY2026 Requirements
The National Electric Vehicle Infrastructure (NEVI) program allocated $885 million for FY2026 disbursement through state DOT programs. Minimum station specification: 4 charging ports at 150 kW each (600 kW total capacity). Each station must demonstrate 97% uptime. Stations must be located within 1 mile of an Interstate highway exit and spaced no more than 50 miles apart along the corridor.
The 97% uptime requirement is the clearest technical argument for on-site solar combined with battery storage at NEVI-funded sites. When the utility grid experiences scheduled maintenance or an unplanned outage, a battery-buffered station continues operating. The charging station is decoupled from grid availability. That single operational characteristic transforms the battery storage ROI conversation: it moves from demand charge savings to meeting the uptime SLA that determines whether the station retains its NEVI funding.
Solar co-located with qualifying DCFC infrastructure is eligible for up to 80% cost reimbursement under NEVI program rules. A $500,000 combined solar-plus-storage project at a qualifying corridor station carries a net CAPEX exposure of $100,000 after reimbursement. The solar and storage economics are structurally different from a standalone commercial project at those cost recovery rates.
Solar’s Role in NEVI-Funded Sites
The NREL battery-buffered DCFC case study lays out the architecture: 4×150 kW DCFC ports operating on a 125 kW grid connection, with a battery buffer supplying 475 kW peak during simultaneous multi-vehicle charging events and 1,632 kWh of daily dispensed energy capacity. The solar array recharges the battery during daylight hours. The grid connection handles base station loads and provides backup charging capacity when solar production and battery state of charge are both low. No service upgrade is required beyond the 125 kW grid connection.
Design the battery for 600 kW peak discharge capacity to cover all 4 DCFC ports running simultaneously at rated power. Solar sizing: target enough daily generation to fully recharge the battery by midday (11 AM to 1 PM peak solar window), based on local PSH and the previous day’s total energy dispensed. For a 1,632 kWh daily energy requirement at 5.0 PSH and 0.80 efficiency: 1,632 ÷ 5.0 ÷ 0.80 = 408 kW of solar array capacity. At NEVI-eligible installed cost of $1.50–$2.50/Wp, that array runs $612,000–$1,020,000 before reimbursement — and $122,000–$204,000 after 80% NEVI cost recovery.
OCPP 2.1 load management matters for the uptime requirement. By preventing charger-to-charger conflicts — where simultaneous peak demand events exceed the battery’s discharge rate — the EMS reduces fault conditions that cause downtime events. Document the OCPP smart charging profile in the NEVI application as a specific uptime assurance measure, including the dispatch logic that prevents overload events.
NEVI Application Timeline Alignment
File the utility interconnection pre-application at project kickoff — before equipment selection, before structural engineering, and before the carport footprint is finalized. NEVI grant disbursement schedules do not accommodate a 3-month interconnection delay that begins in project month 4. State DOTs managing NEVI funds have their own milestone schedules tied to FHWA reporting requirements. A utility queue delay cascades directly into a NEVI milestone miss.
AHJ permitting for solar carport structures adds 4–8 weeks in most jurisdictions, and structural engineering lead time for the stamped drawings adds another 4–6 weeks. Both processes are on the critical path alongside utility interconnection. Run all three in parallel from day one: utility pre-application, structural engineering engagement, and AHJ pre-submittal meeting. Treating them as sequential steps adds 3–4 months to a project schedule that NEVI funding requirements cannot absorb.
Full Cost Reference Table
Use these cost ranges as design-phase budget benchmarks. Actual costs vary by geography, utility service territory, and equipment manufacturer. Always verify current pricing with equipment distributors and local electrical contractors before submitting a proposal.
| Component | Residential | Commercial (10-port L2) | DCFC (4×150 kW NEVI) |
|---|---|---|---|
| L2 EVSE equipment | $1,200–$3,500/unit | $3,000–$8,000/unit | — |
| DCFC equipment | — | — | $25,000–$40,000/unit |
| L2 installation | $1,500–$4,000/charger | $3,000–$8,000/charger | — |
| DCFC installation | — | — | $15,000–$35,000/charger |
| Solar array (EV portion) | $2.50–$3.50/Wp | $2.00–$3.00/Wp | $1.50–$2.50/Wp |
| Battery storage | $400–$800/kWh installed | $400–$800/kWh installed | $400–$800/kWh installed |
| Solar carport premium | N/A | +30–50% vs. rooftop | +30–50% vs. rooftop |
| Trenching/conduit | $15–$35/linear foot | $15–$35/linear foot | $15–$35/linear foot |
| Solar electricity cost | $0.03–$0.08/kWh | $0.03–$0.08/kWh | $0.03–$0.08/kWh |
| Grid electricity (reference) | $0.10–$0.25/kWh | $0.10–$0.25/kWh | ~$0.45/kWh (public DCFC avg) |
Two figures that change the calculation significantly:
NEVI reimbursement covers up to 80% of eligible costs for qualifying stations. Calculate net CAPEX after this offset before presenting any payback period to a client on a corridor DCFC project. The payback math at 20% net CAPEX is structurally different from the same project at 100% self-funded.
Demand charge savings — typically 40–70% reduction from battery storage — should be modeled from 12 months of the client’s actual utility interval data, not applied as a flat percentage to a national average. A site with $8,000/month in demand charges and a 60% reduction delivers $57,600/year in direct savings. A site with $800/month in demand charges delivers $5,760/year. The battery sizing and payback calculation differs by a factor of 10 between these two clients.
Conclusion
Run the load profile first. Every design decision downstream — array size, battery capacity, inverter architecture, service panel sizing — depends on getting the EV kWh/day number right with the correct diversity factor applied. Pull 12 months of utility interval data in 15-minute increments before opening any solar design platform. Build the EV load calculation as a separate worksheet, independent of the building base load, then combine them at the service entrance. The two components require different sizing logic and should remain traceable independently in the design documentation.
Match architecture to site context. New build with high EV load → DC-coupled. Retrofit with an existing solar system already commissioned and interconnected → AC-coupled. This decision locks in early and is expensive to reverse after equipment procurement. The hybrid inverter, the battery system, and the interconnection agreement are all downstream of this choice. Make it deliberately, based on the site’s EV load fraction and retrofit status — not based on what a distributor has in stock.
Start interconnection on day one. The utility application is the longest-lead item on every C&I solar-EV project. File the pre-application before the design is complete, not after the equipment is ordered. For NEVI-funded projects, utility interconnection delay is a funding risk — not just a schedule risk. Parallel-path the utility application, structural engineering, and AHJ pre-submittal from the moment the project is contracted.
Design Your First Solar + EV Charging System in SurgePV
Model charger loads, size the array, and generate a client-ready proposal — in a single workflow.
Book a DemoNo commitment required · 20 minutes · Live project walkthrough
For a direct comparison, see Arka 360 vs SurgePV.
Frequently Asked Questions
How many solar panels do I need for an EV charger?
The number depends on daily EV energy draw and local peak sun hours. For a typical residential vehicle with a 37-mile commute, the daily draw is roughly 12 kWh. At 5.0 PSH and 0.80 system efficiency: 12 ÷ 5.0 ÷ 0.80 = 3.0 kW, which translates to 7–9 panels at 350–400 W each. For a Level 2 commercial port averaging 14 kWh/day at the same location, the dedicated array is approximately 3.5 kW per port. Scale linearly for additional vehicles or higher daily mileage. Panels are sized to the EV load separately from the building base load, then combined for the total system specification.
Can I charge an EV directly from solar panels without a battery?
Yes, with constraints. Direct solar-to-EV charging works well when the vehicle is parked during peak solar hours — roughly 9 AM to 3 PM. Without storage, the charger throttles down when cloud cover reduces solar output, producing slower or interrupted sessions. Most residential systems use a bidirectional inverter that draws grid power to supplement solar when output drops below charger demand. Battery storage removes the dependency on real-time solar production and is generally required for DCFC sites or fleet depots where the bulk of charging happens in the evening.
What is the NEC requirement for EV charger circuit sizing?
NEC Article 625.41 classifies EV charging as a continuous load and requires circuit conductors and overcurrent protection devices to be sized at 125% of the charger’s maximum rated current. A 48A Level 2 charger requires a 60A circuit and #6 AWG copper conductors — not a 50A circuit. This is the most common AHJ rejection on first-time EV charger permit submissions. The ALMS exception under NEC 625.42 allows reduced conductor sizing when an Automatic Load Management System controls simultaneous charger output — which can eliminate the need for a service upgrade on multi-port commercial sites.
How does a diversity factor affect a multi-port commercial EV charging design?
The diversity factor is the fraction of installed charger capacity in simultaneous use at any moment. For a 10-port Level 2 site, the typical factor is 0.7–0.8. Applied to 10 × 11.5 kW: 115 kW × 0.7 = 80.5 kW simultaneous demand. That number drives solar and battery sizing — not 115 kW. The difference between these two figures can change the battery specification from a 100 kWh unit to a 200 kWh unit. The diversity factor does not apply to NEC circuit sizing — each individual circuit is still sized for its full rated load at 125%, regardless of what the rest of the site is doing.
When does adding battery storage to a solar-EV site make financial sense?
Storage makes financial sense when demand charges represent a meaningful portion of the utility bill, which describes most C&I accounts. Demand charges are billed on the highest 15-minute kW peak in the billing period — one EV charger ramp-up event can set that peak for the entire month. Battery storage typically reduces peak demand charges 40–70%, and at $400–$800/kWh installed cost, the payback driven by demand charge savings alone is often 3–6 years. NEVI-funded DCFC stations have a 97% uptime requirement that makes storage operationally necessary regardless of the demand charge calculation.
What is OCPP 2.1 and why does it matter for solar integration?
OCPP 2.1, released in 2025, adds native distributed energy resource control and V2G capability to the EV charger communication protocol. Previous versions handled session management; 2.1 lets the EMS dispatch chargers, set charging rates, and trigger V2G export within the same protocol layer — without custom middleware. For solar integration, this means the EMS can run solar priority charging, demand cap enforcement (the NEC 625.42 ALMS function), and V2G dispatch through a single standardized stack. Early deployments show 18% peak demand reduction and 12% solar self-consumption improvement over unmanaged charging. NEVI sites are expected to require OCPP 2.1 in FY2026 solicitations.
Does NEVI funding cover solar at charging stations?
Yes. Solar co-located with qualifying DCFC infrastructure is eligible for NEVI reimbursement at up to 80% of eligible project costs. The qualifying station specification is: 4 ports at 150 kW minimum, 97% uptime, within 1 mile of an Interstate exit, and spaced no more than 50 miles apart. Battery storage is also eligible. The 97% uptime mandate is the operational argument that makes solar plus storage effectively required — not just financially attractive — at NEVI sites. An on-site battery buffer keeps the station operating during grid maintenance outages, which is the only reliable way to meet the uptime SLA without depending on perfect grid availability.
What vehicles are V2G-compatible in 2026?
V2G-compatible vehicles in 2026 include: Ford F-150 Lightning (9.6 kW V2H/V2G via CCS and Ford Charge Station Pro), Hyundai Ioniq 5 and Ioniq 6 (3.6 kW V2H/V2L via CCS), Kia EV6 and EV9 (V2H/V2L via CCS), Nissan Leaf 2022+ (V2G via CHAdeMO), Volkswagen ID.4 and ID.Buzz (V2H in select markets via CCS), and Tesla Cybertruck (V2H via Tesla connector). V2G export to the grid requires a bidirectional EVSE certified for export, an amended utility interconnection agreement, and OCPP 2.1 dispatch capability — in addition to a compatible vehicle. Confirm utility program enrollment availability before including V2G revenue in any project proposal.