Quick Answer
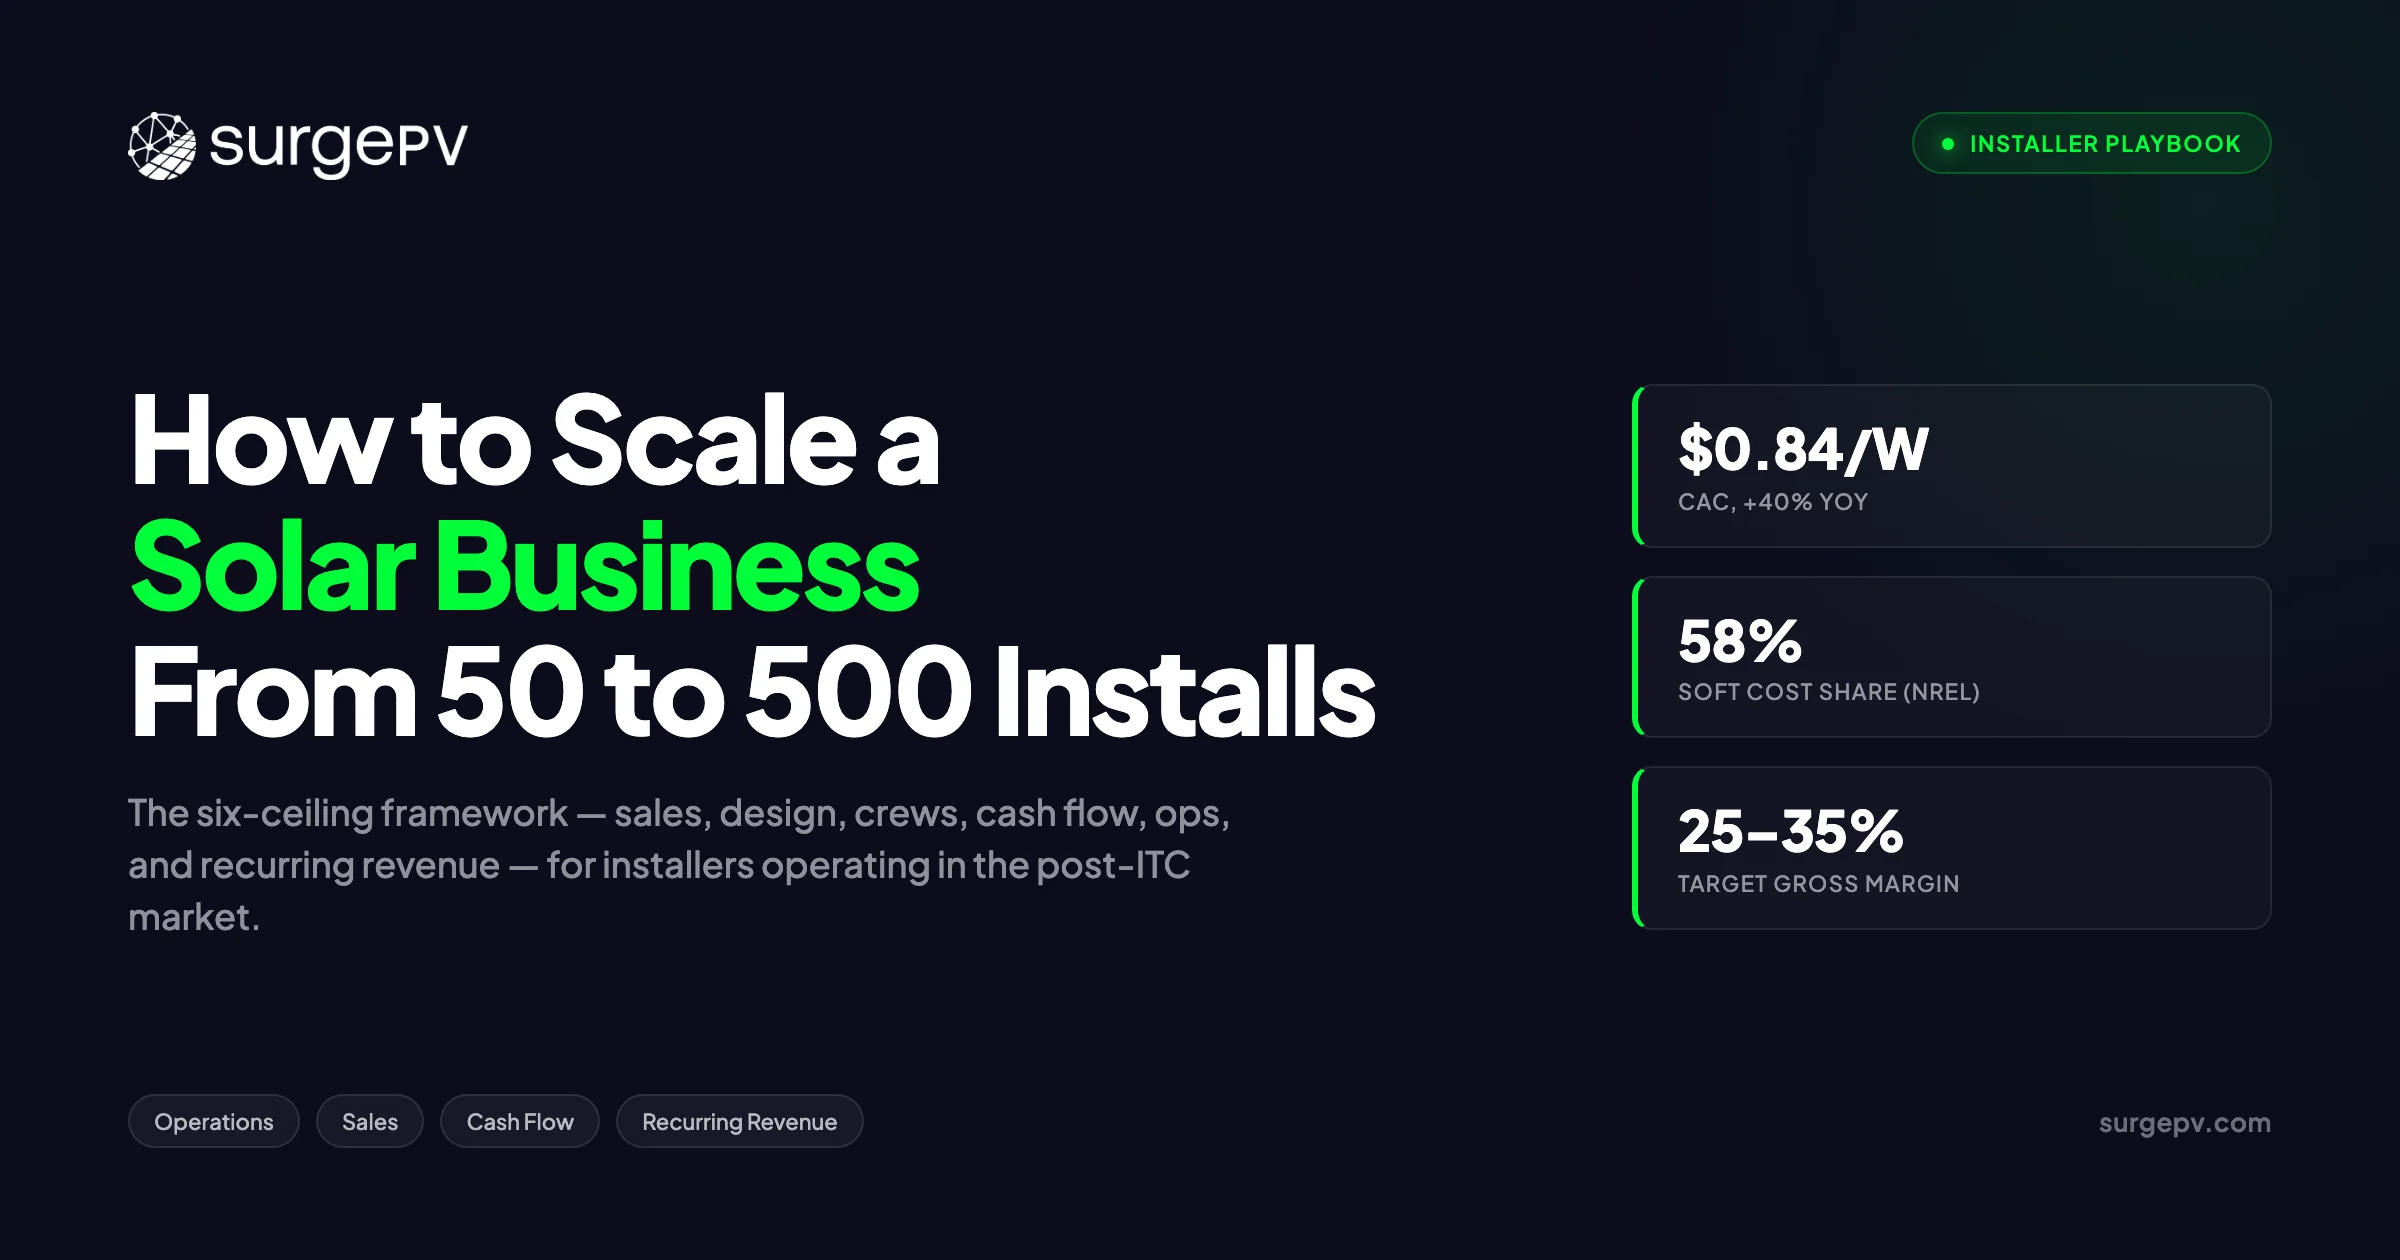
US residential solar is contracting 18–19% in 2026, according to SEIA and Wood Mackenzie . At the same time, residential customer acquisition cost has jumped 40% — from $0.60/W in 2025 to $0.84/W in 2026 . On a median 7.2 kW system, that is $6,048 spent just to get a signed contract, before you pull a permit or order a panel.
US residential solar is contracting 18–19% in 2026, according to SEIA and Wood Mackenzie. At the same time, residential customer acquisition cost has jumped 40% — from $0.60/W in 2025 to $0.84/W in 2026. On a median 7.2 kW system, that is $6,048 spent just to get a signed contract, before you pull a permit or order a panel.
US residential solar is contracting 18–19% in 2026, according to SEIA and Wood Mackenzie . At the same time, residential customer acquisition cost has jumped 40% — from $0.60/W in 2025 to $0.84/W in 2026 . On a median 7.2 kW system, that is $6,048 spent just to get a signed contract, before you pull a permit or order a panel.
Most scaling guides were written during the 2020–2023 growth wave. That market is gone. The businesses that will reach 500 installs per year in this environment are not the ones with the best sales team or the cheapest panels. They are the ones that found and removed six specific operational ceilings — in the right order — before the contraction hit.
This guide walks through each ceiling, the data behind it, and the exact actions to remove it. If you are at 50 installs per year now, the path to 150 is an 18–24 month systems project. The path to 500 is a 3–5 year business transformation.
TL;DR
Scaling from 50 to 500 installs per year means removing six operational ceilings in sequence: owner-dependent sales, design-throughput bottlenecks, crew capacity limits, project-finance cash flow gaps, fragmented ops systems, and one-time-revenue dependence. Target 25–35% gross margins, sub-$0.84/W CAC, and $200–500/customer/year in recurring O&M revenue.
In this guide:
- The four tiers of a solar installation business — and where most companies stall
- Ceiling 1: Owner-dependent sales and the three-stage rep hand-off
- Ceiling 2: Design throughput math and why cloud tools change the equation
- Ceiling 3: W-2 vs. subcontractor crew decisions by tier
- Ceiling 4: The cash flow gap and how to close it without equity
- Ceiling 5: Fragmented operations at 300 installs and how to unify them
- Ceiling 6: Recurring revenue as a hedge against contraction
- Case studies: Freedom Forever, Pink Energy, Titan Solar, Sunder Energy
- A 12-month roadmap from 50 to 150 installs
Featured Answer: To scale a solar installation business from 50 to 500 installs per year, remove six operational ceilings in order: owner-dependent sales, design-throughput bottlenecks, crew capacity limits, project-finance cash flow gaps, fragmented ops systems, and one-time-revenue dependence. Target 25–35% gross margins, sub-$0.84/W CAC, and $200–500/customer/year in recurring O&M revenue.
The Four Tiers: What Scaling Actually Means at Each Stage
Before you can remove a ceiling, you need to know which tier you are in. The challenges at 50 installs per year are structurally different from the challenges at 300. Using a 500-install solution on a 50-install problem wastes money and time.
| Tier | Installs/Year | Revenue Range | Headcount | Primary Bottleneck | Key KPIs |
|---|---|---|---|---|---|
| Tier 1 | 0–50 | Under $1.5M | 3–8 | Owner bandwidth | Close rate, referral %, gross margin |
| Tier 2 | 50–150 | $1.5M–$5M | 8–25 | Design throughput + sales handoff | Proposals/designer/day, CAC |
| Tier 3 | 150–300 | $5M–$10M | 25–60 | Crew capacity + cash flow | Crew utilization, working capital days |
| Tier 4 | 300–500 | $10M–$18M | 60–120 | Ops fragmentation + revenue mix | Recurring revenue %, ops dashboard uptime |
The revenue ranges assume residential projects at approximately $3.35/Wdc (Wood Mackenzie/SEIA Q3 2025) and median system size of 7.2 kW (LBNL), which puts average revenue per install around $24,000–$25,000. Your actual numbers will vary by market.
Where Most Installers Stall
The Tier 1 to Tier 2 transition is where we see the highest failure rate. Most owners assume the stall is a sales problem — they need more leads, more reps, more marketing spend. In most cases, the actual constraint is design throughput. New reps generate proposals the existing design process cannot handle, so lead times blow out, customer experience degrades, and close rate falls. Fix design capacity before you hire sales.
Ceiling 1: Owner-Dependent Sales
The first ceiling is the most common and the hardest to see from inside. At Tier 1, the owner closes 70–80% of deals — often with a 40–60% close rate that no hired rep can replicate. That close rate is built on local credibility, personal relationships, and years of objection-handling experience. None of it is documented.
The problem is not the owner’s close rate. The problem is that growth is capped at whatever the owner can personally sell.
The three-stage rep hand-off
Moving from owner-closed to rep-closed is a staged process, not a switch.
Stage 1 (months 1–3): Shadow and document. The owner closes every deal normally, but a designated rep attends every appointment and records every objection handled. By month 3, you have a 15–20 page objection library that doubles as a training manual.
Stage 2 (months 4–6): Co-close. The rep runs the presentation. The owner is in the room but does not speak unless the rep explicitly hands off. The rep’s close rate will be 25–35% initially — that is expected. The owner debrief after each appointment is the training program.
Stage 3 (months 7–12): Independent close with pipeline review. The rep closes independently. Owner reviews all lost deals weekly — not to second-guess, but to update the objection library. Target close rate for a trained rep after 12 months: 30–40%.
Owner vs. trained rep — KPI comparison
| KPI | Owner (Year 1) | Trained Rep (Month 12) | Gap |
|---|---|---|---|
| Close rate | 45–60% | 30–40% | 10–20 pts |
| Proposals needed per close | 2–3 | 3–4 | 1 more |
| CAC per deal | $3,200–$4,500 | $5,000–$6,500 | +30–40% |
| Deals/month capacity | 4–6 | 6–10 | Rep handles more volume |
| Owner time required | 40+ hrs/month | 2–4 hrs/month review | Frees owner |
The rep’s higher CAC is offset by volume and by the owner’s time returning to operations and strategy.
NREL’s 2025 analysis puts soft costs at 58% of total residential solar+storage project cost. A meaningful share of those soft costs are sales-related — repeated site visits, long proposal cycles, and rework from poor handoffs. A documented sales process reduces all three.
Common mistakes at this stage:
- Hiring reps before the sales process is written down. You cannot train to a standard that does not exist.
- Commission-only comp in months 1–6. Good reps will not take the risk, so you get desperate applicants instead.
- Over-relying on referrals at Tier 2. Referrals are margin-positive and should be cultivated, but they cannot be the growth engine past 100 installs per year.
Mini-FAQ: How many reps do I need to reach 150 installs per year?
At 150 installs per year, you need roughly 225–300 proposals to close 150 contracts (at a 50–65% close rate across the funnel). One strong rep running 10–15 appointments per month can generate 6–8 signed contracts per month, or 72–96 per year. You need 2 reps at minimum, 3 for headroom. The design team must be sized to match — see Ceiling 2.
For solar installers at the Tier 1 to Tier 2 transition, this rep-to-designer ratio is the most commonly misaligned variable in the business.
Pro Tip
Every closed objection is a training asset. Start a shared doc on day one of Stage 1. Title each entry with the objection verbatim. Record the exact response that worked. After 6 months, that document is your onboarding program, your sales manager’s playbook, and your quality standard — all in one place.
Ceiling 2: Design Throughput — The Bottleneck Nobody Talks About
Design throughput is the second ceiling, and it is the one most installers discover too late. At 50 installs per year, the design workload is manageable — 75–100 proposals annually, roughly 1–2 per week. At 150 installs per year, that number triples to 225–300. At 300 installs, you are generating 450–600 proposals per year. At 500, you need 750.
The math behind those numbers matters.
The desktop CAD reality
A skilled designer using desktop CAD software can generate 4–8 proposals per day — on a clean day with no revisions, no AHJ corrections, and no same-day site visit requests. In practice, those three interruptions consume 40–60% of a designer’s week. Real-world throughput is closer to 3–5 proposals per day.
At 220 working days per year and 4 proposals per day, one designer produces 880 proposals annually — which sounds like enough to support 500 installs. But that number assumes zero revision cycles, zero AHJ resubmissions, and zero seasonal surge. None of those assumptions hold.
At 150 installs per year, you need 225–300 proposals. One designer at 4/day handles it — barely, with no slack. Add a seasonal surge month and you are immediately over capacity.
At 300 installs per year, you need 450–600 proposals. You need 2–3 designers. The marginal cost of each additional designer is $60,000–$85,000 per year in salary plus benefits — before you factor in the cost of their idle time during slow months.
Cloud parallel design changes the math
Solar design software, purpose-built for cloud parallel workflows, changes the throughput equation at scale. A 2-person design team using concurrent sessions, a template library, and automated shading analysis can generate 30–50 proposals per day — not per designer, per team.
The reasons are structural. Cloud tools eliminate the file-locking and version-control friction of desktop CAD. A template library for common roof types reduces per-proposal setup from 45–60 minutes to 10–15 minutes. Automated shade analysis via satellite imagery removes the manual shading step entirely. Proposal export to a client-facing PDF takes seconds rather than the 20–30 minutes required to format a desktop export. Read [Solar Shading Analysis Guide](/blog/solar-shading-analysis-guide) for a complete walkthrough.
Solar shadow analysis software integrated directly into the design workflow eliminates one of the biggest revision drivers — proposals sent to customers with inaccurate production estimates because shading was eyeballed rather than calculated.
The 500-install math, desktop vs. cloud
| Scenario | Proposals Needed/Year | Designer Throughput | Designer-Days Required | FTE Required |
|---|---|---|---|---|
| 500 installs, desktop CAD | 750 | 4/day | 187.5 days | 1.0–1.5 FTE |
| 500 installs, cloud (2-person team) | 750 | 30–50/day (team) | 15–25 days | 0.5 FTE equivalent |
| Seasonal surge month (15% of annual volume) | 112 in one month | 4/day desktop | 28 designer-days in 20 working days | Overtime or miss SLA |
The cloud scenario does not require fewer designers — it requires fewer designer-days per proposal, which means less overtime, less burnout, and better quality on every proposal.
Monday morning workflow at 150 installs per year
This is what a well-run design operation looks like at Tier 2:
- 7:00 AM: Designer opens the proposal queue in solar design software. Overnight, the sales team has dropped 8 new project briefs — address, roof photos from the site visit, system size preference, any shading concerns noted.
- 7:15 AM: Pull the first 3 addresses. The template library has pre-built configurations for the top 10 roof types in your service area. Two of the 3 jobs match existing templates. Designer loads the template, drops in the address, and the satellite imagery and shading model populate automatically.
- 8:30 AM: First 3 proposals are complete and in the review queue. Clara AI has flagged a pitch discrepancy on roof section 2 of job 3 — designer adjusts before it goes to the customer.
- 10:00 AM: 3 more proposals queued. System size auto-calculated from roof area and shading output. Solar proposal software exports a branded PDF in 45 seconds.
- End of day: 12–15 proposals completed. Zero AHJ flags because the design checks against local interconnection standards automatically.
That workflow is not aspirational — it is what cloud tools make repeatable.
Design mistakes that kill Tier 2 companies
- Hiring a second designer before fixing the process. Two people doing a slow process produces twice the backlog, not half the backlog.
- Using desktop CAD for commercial and industrial jobs because “it is what the engineer knows.” C&I projects have longer permit cycles and more complex shading scenarios — exactly where cloud tools’ parallel review features matter most.
- Treating quality and speed as a trade-off. In our work with installers, the highest-quality proposals come from standardized templates with automated checks — not from designers with more time. Speed and accuracy are the same variable when the process is right.
The Invisible Bottleneck
Design throughput is invisible at 50 installs per year. At 150, it becomes the reason your close rate is falling — customers are waiting 5 days for a proposal from a company that promised 24–48 hours. Fix this before you hire your second sales rep.
See How Fast Your Team Can Generate Proposals
SurgePV’s cloud design platform is built for installer teams that need to move from site visit to signed proposal in under 24 hours.
Book a DemoNo commitment required · 20 minutes · Live project walkthrough
For a direct comparison, see Arka 360 vs SurgePV.
Ceiling 3: Crew Capacity and the Subcontractor Problem
A single experienced subcontractor crew installs 8–12 residential systems per month, or 96–144 per year, assuming good weather, no permit delays, and reliable material delivery. That ceiling is enough for Tier 1. At Tier 2 and above, you need multiple crews — and the question becomes whether to use W-2 employees or subcontractors.
The answer depends on your current tier.
W-2 vs. subcontractor — by tier
| Factor | Subcontractors | W-2 Employees |
|---|---|---|
| Fixed cost | Low — pay per job | High — wages, benefits, insurance year-round |
| Schedule control | Low — they have other clients | High — you own the calendar |
| Appropriate tier | Tier 1–2 (under 150 installs) | Tier 3–4 (150+ installs) |
| Scaling risk | Can’t add capacity fast | Training cycle is 60–90 days |
| Quality control | Harder to enforce standards | Direct management, consistent standards |
| Primary risk | Scheduling conflicts at surge | Idle cost during slow months |
The transition point is not a headcount number — it is a utilization number. When your subcontractor crews are running at 85%+ utilization for 6 consecutive months, the variable cost of subcontractors plus the scheduling friction of not controlling the calendar exceeds the fixed cost of W-2 lead installers.
The A/B/C subcontractor tier system
At Tier 1–2, structure your subcontractor pool into three tiers:
- A-tier: 1–2 crews with perfect track record on quality, timeline, and communication. Get first call on all jobs. Reserved for your highest-value customers.
- B-tier: 2–3 crews that are reliable but require closer supervision. Standard residential volume.
- C-tier: Overflow crews used only during surge months. Every C-tier job gets a same-day quality check.
This system lets you scale from 50 to 120 installs per year on subcontractors without losing quality control. It also gives you real data on which crews to absorb as W-2 when you make the transition.
IREC’s 2025 workforce report puts the median solar PV installer wage at $60,300 per year. Loaded cost with benefits, payroll tax, and workers’ comp runs 1.25–1.35x base, or $75,400–$81,400 per year per installer. That is your W-2 break-even threshold — the volume at which that fixed cost is cheaper than subcontractor variable cost plus scheduling risk. For United States-specific compliance details, see United States arizona/phoenix. For United States-specific compliance details, see United States california/los-angeles.
The collapse of Titan Solar (closed June 2024) illustrated the opposite problem: a dealer-network model that scaled headcount rapidly without building the operational infrastructure to manage quality and cash across a dispersed installer base. High volume without process control generates comeback costs that eat into margin faster than any CAC increase.
Crew capacity mistakes to avoid:
- Waiting for a quality failure before adding crew. By the time you notice quality degradation, you have already absorbed comeback costs and customer churn.
- Scheduling subcontractors week-to-week instead of month-to-month. Crews plan their calendars on 4-week cycles. Last-minute requests go to whatever crew is desperate for work — often not your A-tier.
- Making the W-2 decision based on one good month. Run 6 months of utilization data before committing to W-2 cost structure.
Pro Tip
Pull your crew utilization data for the last 6 months before making any W-2 hiring decision. If the 6-month average is under 75%, the slow months will make W-2 cost punishing. If it is above 85% consistently, you are already losing money on scheduling friction — the W-2 transition will pay for itself within a quarter.
Ceiling 4: The Cash Flow Gap
Cash flow is the fourth ceiling, and the one most likely to kill a business that is otherwise doing everything right.
Here is the math. At 300 installs per year — roughly $25,000 average revenue per install — your annual revenue is $7.5M. Standard residential solar payment terms run 50% on contract and 50% on install completion. If your average project cycle from signed contract to install completion is 60 days, you have approximately $1.25M tied up in work-in-progress at any given time. That is money you have earned but cannot access.
Scale to 500 installs and the float grows proportionally — closer to $2M tied up in WIP on a $12.5M revenue base.
The Freedom Forever Chapter 11 filing in April 2026 was a cash flow failure at scale. Revenue was not the problem. The company was doing significant volume. The problem was that growth-stage capital structure — the reliance on dealer networks and aggressive expansion — created a financing gap that compressed margins could not close. The Pink Energy bankruptcy in October 2022 was a different flavor of the same issue: rapid scaling into markets with high comeback rates, where warranty costs destroyed the margin on the way up.
4 tools to close the cash flow gap
1. Milestone billing. Restructure payment to three milestones: 30% on signed contract, 40% on permit approval, 30% on install completion. This reduces your 60-day float to roughly 20 days on the largest payment tranche. Customers accustomed to two-payment terms will push back — have the conversation upfront and frame it as project management best practice, not a cash grab.
2. Distributor net terms. Tier 1 and Tier 2 solar distributors offer net-30 to net-60 terms on panels and inverters for established accounts. This does not solve cash flow, but it shifts the timing of your largest input cost. A business doing $5M in annual revenue can often access $300,000–$500,000 in distributor credit — essentially a free working capital line.
3. Revenue-based financing against backlog. Several specialty lenders now offer revenue-based advances against signed-contract backlog for solar installers. The rate is higher than a bank line, but the qualification criteria are simpler. A $500,000 advance against $2M in signed backlog at 1.5x payback over 12 months costs roughly $250,000 — expensive, but materially cheaper than equity at Tier 2.
4. Commercial project diversification. Commercial solar grew 6% in 2025 to 2,345 MWdc (SEIA). Commercial projects run on 30–60 day payment cycles from institutional or business customers who are accustomed to milestone billing. Adding 10–15% commercial volume to a predominantly residential business smooths cash flow and reduces exposure to residential market swings.
The generation and financial tool lets you model project-level cash flow — including carry cost, milestone timing, and payback period — before committing to a contract structure. At Tier 2 and above, that kind of per-project financial modeling is not optional.
Cash flow KPIs to track monthly:
| KPI | Tier 2 Target | Tier 3 Target | Tier 4 Target |
|---|---|---|---|
| Working capital days | Under 45 | Under 35 | Under 25 |
| Non-install revenue % | 5–10% | 10–20% | 20%+ |
| Distributor credit utilization | Under 60% | Under 50% | Under 40% |
| Backlog coverage (months of runway) | 2+ | 3+ | 4+ |
Cash Flow Problems Look Like Operations Problems
When installs start slipping deadlines and customer communication degrades, owners usually diagnose it as a scheduling or staffing issue. Often, the root cause is that the business ran short on working capital and began prioritizing jobs that had received payment over jobs that had not — creating a reinforcing cycle of delays and customer dissatisfaction. Fix the billing structure first.
Ceiling 5: Fragmented Operations
At 50 installs per year, you can run the business across spreadsheets, a CRM, and a shared inbox. At 300 installs per year, that approach generates 5 parallel data streams — leads, designs and proposals, permitting, scheduling, and post-install service — each managed in different tools, by different people, with no unified view.
The cost of that fragmentation shows up in three places: duplicate data entry, permit errors from mismatched versions of design files, and scheduling conflicts from crews and project managers working off different calendars.
NREL’s 2025 soft cost analysis attributes a meaningful portion of the 58% soft cost share to permitting cycles, interconnection delays, and project management overhead — all of which compound when the data systems are fragmented.
Unified dashboard walkthrough at 300 installs per year
A well-structured ops system at Tier 3 connects five workflow stages into a single dashboard:
- Lead to proposal: CRM captures the lead. Designer picks up the address from the queue in solar design software. Proposal generated and logged against the lead record automatically.
- Proposal to permit: When the customer signs, the design file is locked and submitted for permit. Permit status updates in the central dashboard, not a separate tracker.
- Permit to schedule: Permit approval triggers an automatic scheduling prompt. Crew availability pulled from the crew calendar. Install date confirmed in the customer portal.
- Install to inspection: Installer marks job complete in the mobile app. Inspection request triggered automatically. Pass/fail logged against the project record.
- Inspection to service: Post-install, the customer record moves into the service queue. O&M contract sent automatically at 30 days post-inspection.
Solar software built for this workflow — where the same platform handles design, proposal, and project tracking — eliminates the translation layer between stages. Solar designing tools that integrate with project management rather than sitting as a standalone application are the difference between an ops manager spending 2 hours per day on status updates and 20 minutes.
Operations mistakes that compound at Tier 3:
- Adding headcount to manage fragmentation instead of fixing the fragmentation. Hiring a second project coordinator to manage a broken system creates two people managing a broken system.
- Custom-building integrations between disconnected tools. A $200/month solar-specific platform outperforms a $50,000 custom integration in uptime and adoption rate.
- Not auditing where the ops manager’s time actually goes. In our experience, ops managers at Tier 2–3 companies spend 35–50% of their time on tasks that would be automated in a unified platform.
Pro Tip
Ask your ops manager to track their time for two weeks before you evaluate any new platform. The output is almost always the same: 30–40% of their week goes to status checks, data reconciliation, and chasing permit updates that should populate automatically. That time audit is the business case for the platform investment.
Ceiling 6: One-Time Revenue Dependence
The sixth ceiling is the one the 2026 contraction makes existential. An 18–19% decline in residential volume means that a business doing 100 installs in 2025 will see inbound demand support for 81–82 installs in 2026 — unless it actively captures market share. For businesses with no recurring revenue, every slow month is a full stop on cash flow.
Three recurring revenue streams are available to residential solar installers at every tier.
Stream 1: O&M contracts ($200–500/year/customer)
Operation and maintenance contracts cover annual system inspection, monitoring review, panel cleaning, and priority response for service calls. Price point is $200–500 per year depending on system complexity and geography. At 150 installs per year over 3 years, you have an installed base of 350–400 customers. At $300/year average, that is $105,000–$120,000 in recurring annual revenue — before you install a single new system.
The retroactive O&M sale is simpler than most installers expect. Call your existing 50–150 customer base. Script: “We are launching a monitoring and maintenance program. For $299 per year, we handle the annual inspection, monitor your system remotely, and guarantee 48-hour response on any service call. Do you want to be grandfathered in at the founding price?” Conversion rates in our work with installers run 25–40% on an existing customer base.
Stream 2: Battery and VPP attachment
Sunrun reported 70% battery attachment on new residential installs in 2025, with revenue of $2.96B — a 45% increase year-over-year. That is not a large-company-only outcome. Battery attachment rates for Tier 2 installers in high-rate states like California, Hawaii, and Massachusetts are running 40–60% on new installs with the right sales process.
Virtual power plant programs — where installers aggregate customer battery capacity and sell grid services — are available through several utilities and aggregators. The recurring revenue per enrolled customer runs $100–300/year, with the aggregator handling the grid dispatch. Read Solar Battery Sizing Guide for a complete walkthrough.
Stream 3: Commercial maintenance
Commercial solar grew 6% in 2025 to 2,345 MWdc. Commercial system owners — schools, municipalities, businesses — have annual maintenance obligations under their financing agreements and generally prefer to contract with the original installer. Commercial maintenance contracts run $500–2,000/year per site depending on system size. At 20 commercial sites, that is $10,000–$40,000 in annual recurring revenue.
What failure and success look like
Sunder Energy built to 70,000 installs over 4 years using a capital-light dealer-network model, reached $74M in revenue in 2025, and was acquired by SunPower in September 2025 for $40M plus 10M shares. The model worked at scale — but the ceiling of a dealer network without proprietary recurring revenue was evident enough that the exit was a sale, not an IPO.
Trinity Solar, by contrast, has built a steady regional business in the Northeast through service diversification and a consistent customer base. It survived the 2022–2024 consolidation cycle by maintaining gross margins above 25% and growing its O&M book alongside its install volume.
Every Install Is a Future O&M Customer
The install is not the end of the customer relationship — it is the beginning of a 25-year asset ownership period. Every system you install is a recurring revenue opportunity. At Tier 3 and 4, the installed base is worth more than the new-install pipeline in a down market.
At Tier 3 and Tier 4, target recurring revenue at 15%+ of total business revenue. Link to commercial solar opportunities as a natural complement to a residential O&M program — many residential customers own or manage commercial properties. For pricing the service packages, SurgePV’s pricing page provides a starting reference for software-bundled service tiers.
The Headcount-to-Revenue Map
Headcount scales with volume, but the ratio changes at each tier. A business that is not generating revenue-per-employee growth as it scales is absorbing overhead faster than it is building capacity.
| Tier | Installs/Year | Total Headcount | Revenue/Employee Target | Notes |
|---|---|---|---|---|
| Tier 1 | 0–50 | 3–8 | $150,000–$250,000 | Owner does 3–4 roles |
| Tier 2 | 50–150 | 8–25 | $160,000–$280,000 | First specialist hires (designer, PM) |
| Tier 3 | 150–300 | 25–60 | $170,000–$300,000 | W-2 crew transition; ops manager critical |
| Tier 4 | 300–500 | 60–120 | $160,000–$280,000 | Some dilution from overhead; offset by recurring revenue |
Revenue per employee should hold approximately flat or increase as you move from Tier 1 to Tier 3. If it is falling, you are adding headcount faster than capacity. The most common cause: hiring designers to compensate for a slow design process, or hiring PMs to manage operational fragmentation.
Cloud Design Software Changes the Headcount Math
The headcount ranges above assume cloud-based solar design software throughout. Desktop CAD workflows require 30–40% more design headcount at the same install volume. At Tier 3, that is 3–4 additional design FTEs — or $200,000–$350,000 in annual salary cost — for the same proposal throughput.
What Failure Looks Like: Four Case Studies
| Company | Failure Type | Tier at Failure | Year | What Happened |
|---|---|---|---|---|
| Freedom Forever | Cash flow at scale | Tier 3→4 | April 2026 | Aggressive expansion through dealer network; growth-stage capital structure could not absorb compressed margins at scale; filed Chapter 11 |
| Pink Energy | Overscaled service without margin | Tier 2→3 | October 2022 | Rapid expansion into new markets; high warranty/comeback rates from installation quality issues; warranty obligations exceeded margin; collapsed under service liability |
| Titan Solar | Dealer network without ops infrastructure | Tier 2→3 | June 2024 | National dealer model scaled headcount without building the operational backbone to enforce quality and manage cash across a dispersed installer network; closed June 2024 |
| Sunder Energy | Capital-light ceiling | Tier 3→4 | Acquired September 2025 | 70,000 installs in 4 years; $74M 2025 revenue; 893-person dealer force. The model worked but had a structural ceiling — acquired by SunPower for $40M + 10M shares rather than scaling independently |
The Tier 2→3 Transition Is the Danger Zone
Three of the four case studies failed at the Tier 2 to Tier 3 transition — the same point where cash flow gaps open, crew capacity becomes a fixed-cost decision, and ops fragmentation starts compounding daily. This is not coincidence. It is the stage where the informal systems that worked at 50 installs per year collide with the formal infrastructure requirements of 150+ installs.
The contrast is Trinity Solar — a Northeast regional installer that held 25%+ gross margins, built a consistent O&M book alongside install volume, and declined to compete on national scale. It survived every consolidation wave since 2018 by doing fewer things with more discipline.
The 12-Month Scaling Roadmap (50 to 150 Installs)
This roadmap is sequenced intentionally. The order matters. Ceiling 2 (design throughput) comes before the sales hire — not after — because a new rep generating 40 additional proposals per month into a constrained design process creates delays, not growth.
| Quarter | Ceiling | Priority Actions | Target Outcome |
|---|---|---|---|
| Q1 | Ceiling 2 (first), Ceiling 1 | Move to cloud design platform; build proposal template library for top 10 roof types; begin documenting sales objection library with owner | Design throughput 15+ proposals/day; objection library started |
| Q2 | Ceiling 1 (cont.), Ceiling 3, Ceiling 4 | Hire first rep; begin Stage 1 co-close process; tier subcontractor pool into A/B/C; restructure payment to 3-milestone billing | Rep at Stage 2 close; A-tier crew for all volume; working capital days under 50 |
| Q3 | Ceiling 5, Ceiling 6 | Implement unified ops dashboard; launch retroactive O&M program to existing installed base | 80%+ projects in unified system; first O&M contracts signed |
| Q4 | Ceiling 3 (revisit), new pipeline | Pull 6-month crew utilization data; make W-2 decision if above 85%; open commercial pipeline | W-2 decision made with data; first commercial project in pipeline |
Why Ceiling 2 comes first in Q1
The instinct is to hire a sales rep first — more leads, more revenue, growth. But a new rep at 10–15 appointments per month generates 6–8 proposals per week into your design queue. If your design process cannot handle that volume, proposal turnaround time blows out from 24 hours to 4–5 days. Your close rate falls because customers accept a competitor’s faster proposal. The new rep quits or underperforms because their pipeline is stalling in the design queue.
Fix the design bottleneck first. Then hire the rep into a process that can support their volume.
Conclusion: Three Actions This Week
The 2026 contraction is already underway. Residential solar is forecast to decline 18–19% this year, and CAC has already reached $0.84/W — levels that make Tier 1 and Tier 2 economics marginal without operational efficiency. The businesses that scale through this cycle will be the ones that acted on the six ceilings before the contraction forced their hand.
Three actions you can take this week, regardless of your current tier:
1. Calculate your proposals-per-designer-per-day. Take last month’s total proposal output. Divide by the number of designers. Divide by working days. If the number is under 6, your design process is already constraining growth. At 150 installs per year, you need it above 10.
2. Pull your 6-month install variance. Find the spread between your highest-volume month and lowest-volume month over the past 6 months. If the variance is above 30%, your scheduling system — not your sales pipeline — is the primary growth constraint.
3. Calculate your O&M opportunity. Count your installed base. Multiply by $300. That is your annual recurring revenue opportunity from O&M contracts alone. At 150 systems installed: $45,000/year. At 300 systems: $90,000/year. That revenue exists already — you have not captured it yet.
The market is contracting. The soft cost structure remains 58% of total project cost. The installers who fix the six ceilings outlined here are the ones who will be at 500 installs per year when the market recovers.
Cut Design Time. Close More Projects. Scale with Confidence.
SurgePV’s solar design platform is built for installer teams scaling from 50 to 500 installs per year — proposal throughput, automated shading, and financial modeling in one tool.
Book a DemoNo commitment required · 20 minutes · Live project walkthrough
Frequently Asked Questions
How long does it take to scale a solar installation business from 50 to 500 installs per year?
Three to five years with intentional systems investment. The Tier 1 to Tier 2 jump (50 to 150 installs) typically takes 18 to 24 months when you address design throughput and sales process in parallel. The Tier 2 to Tier 3 jump (150 to 300) takes another 18 to 30 months, depending on cash flow discipline and the speed of the crew capacity transition. Tier 3 to Tier 4 (300 to 500) is the longest stage — 24 to 36 months — because it requires both operational unification and a meaningful recurring revenue base.
What is a good gross margin for a solar installation business?
25 to 35% on residential projects is the benchmark for a scalable business. Below 20%, there is not enough margin to absorb CAC, overhead, and comeback costs simultaneously. At $3.35/Wdc system pricing and a 7.2 kW median system, gross revenue per install is roughly $24,100. A 25% gross margin leaves $6,025 per install to cover overhead — adequate at Tier 2, tight at Tier 3. Commercial projects can run tighter margin percentages but generate higher gross profit per project on larger system sizes.
How much does customer acquisition cost for residential solar in 2026?
$0.84 per watt as of 2026, up from $0.60/W in 2025 — a 40% increase in one year, per Wood Mackenzie. On a 7.2 kW median residential system, that works out to roughly $6,048 in CAC per customer signed. Businesses with a strong referral program and documented sales process typically run 15–25% below the market average CAC. Businesses relying primarily on paid digital leads are often running above it.
Should a solar installer use W-2 employees or subcontractors for installs?
Subcontractors for under 100 installs per year. Begin transitioning to W-2 lead installers at 150-plus installs per year, when crew utilization is consistently above 85% and variable subcontractor scheduling is the primary delivery risk. The loaded W-2 cost of a solar PV installer runs $75,000–$81,000 per year (based on IREC’s $60,300 median wage at 1.25–1.35x loaded cost). That fixed cost is justified when scheduling friction from subcontractors is costing more than the savings on slow months.
What recurring revenue can a solar installation company earn after the install?
$200 to $500 per customer per year through O&M contracts covering annual inspection, remote monitoring, and priority service response. On an installed base of 300 customers, that is $60,000 to $150,000 per year — enough to fund one full-time service technician and provide meaningful buffer against new-install volume swings. Commercial maintenance contracts on installed commercial sites run $500–2,000 per site annually.
How is the 2026 residential solar contraction affecting small installers?
US residential solar is forecast to contract 18 to 19% in 2026, per SEIA and Wood Mackenzie. For installers at 50 to 150 installs per year, this means fewer inbound leads, higher CAC on the leads that do come in ($0.84/W vs. $0.60/W), and thinner margins from pricing pressure. Businesses without recurring revenue or efficient design operations are most exposed — one slow quarter can trigger a cash flow crisis when working capital is already stretched across a 60-day project cycle. The businesses that survive and grow through this cycle are the ones that addressed the six operational ceilings before the contraction forced their hand.